


US Dollar Vs Euro, British Pound, Japanese Yen, Australian Dollar – Price Setups:
- The US dollar’s rally is showing signs of fatigue.
- Markets expect the Fed to keep interest rates on hold at next week’s meeting.
- What’s next for EUR/USD, GBP/USD, AUD/USD, and USD/JPY?
Supercharge your trading prowess with an in-depth analysis of USD's outlook, offering insights from both fundamental and technical viewpoints. Claim your free Q4 trading guide now!

The US dollar’s rally is showing signs of fatigue ahead of the Oct. 31-Nov.1 FOMC meeting. Markets are pricing in a 98% chance that the Fed will keep interest rates on hold after a number of Fed officials recently pointed out that the tightening in financial conditions as a result of the jump in yields has reduced the need for imminent tightening – a point echoed by Fed chair Powell last week. For more details, see “US Dollar Outlook After Powell: GBP/USD, AUD/USD, EUR/USD Price Action,” published October 20.
Meanwhile, technical charts suggest that the greenback could be in the process of setting a short-term peak – a risk highlighted earlier this month. See “US Dollar Showing Tentative Signs of Fatigue: EUR/USD, GBP/USD, USD/JPY,” published October 5.
DXY Index: Upward pressure could be easing a bit
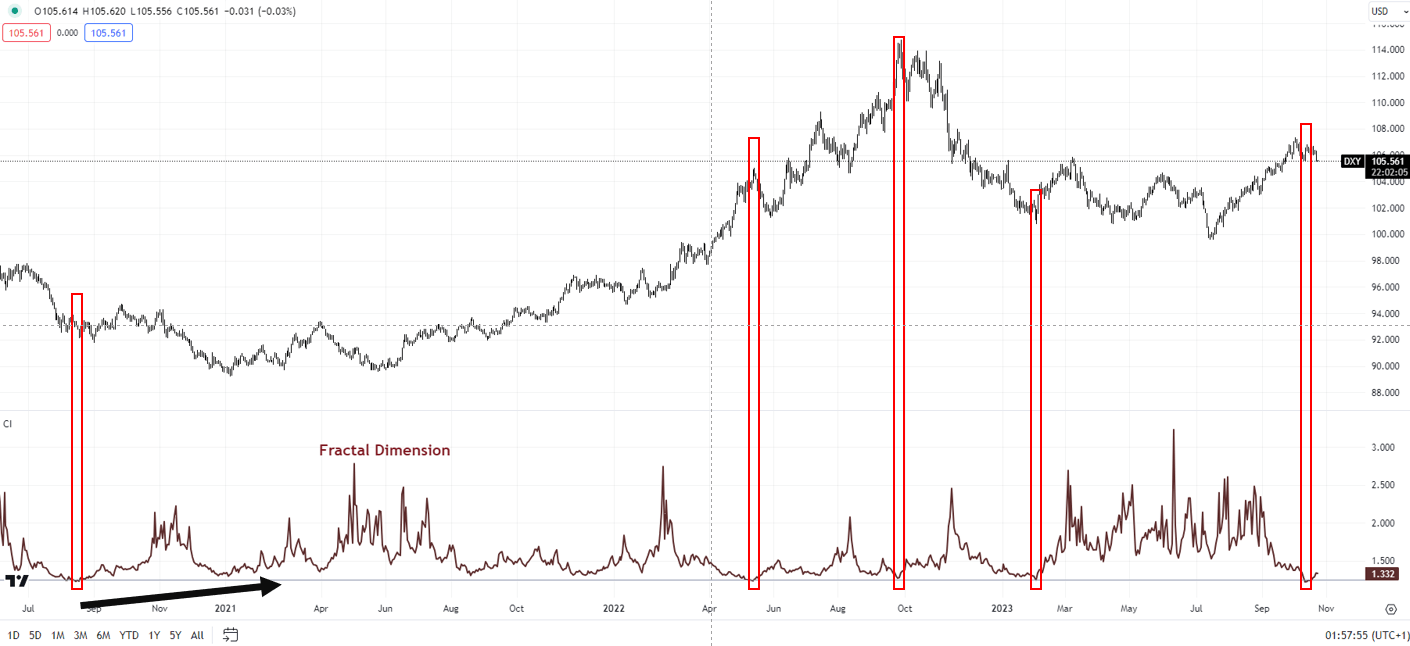
Chart Created by Manish Jaradi Using TradingView
DXY Index: Interim peak in place?
Market diversity, as measured by fractal dimensions, appears to be low as the DXY Index hit a multi-month high earlier this month. Fractal dimensions measure the distribution of diversity. When the measure hits the lower bound, typically 1.25-1.30 depending on the market, it indicates extremely low diversity as market participants bet in the same direction, raising the odds of at least a pause or even a price reversal. For the DXY Index, recently the 65-day fractal dimension fell below the threshold of 1.25, flashing a red flag, pointing to a consolidation/minor retreat at the very least. For more discussion, see “Has the US Dollar Rally Hit Limits? DXY Index Fractals, Price Action,” published October 17.
EUR/USD Daily Chart
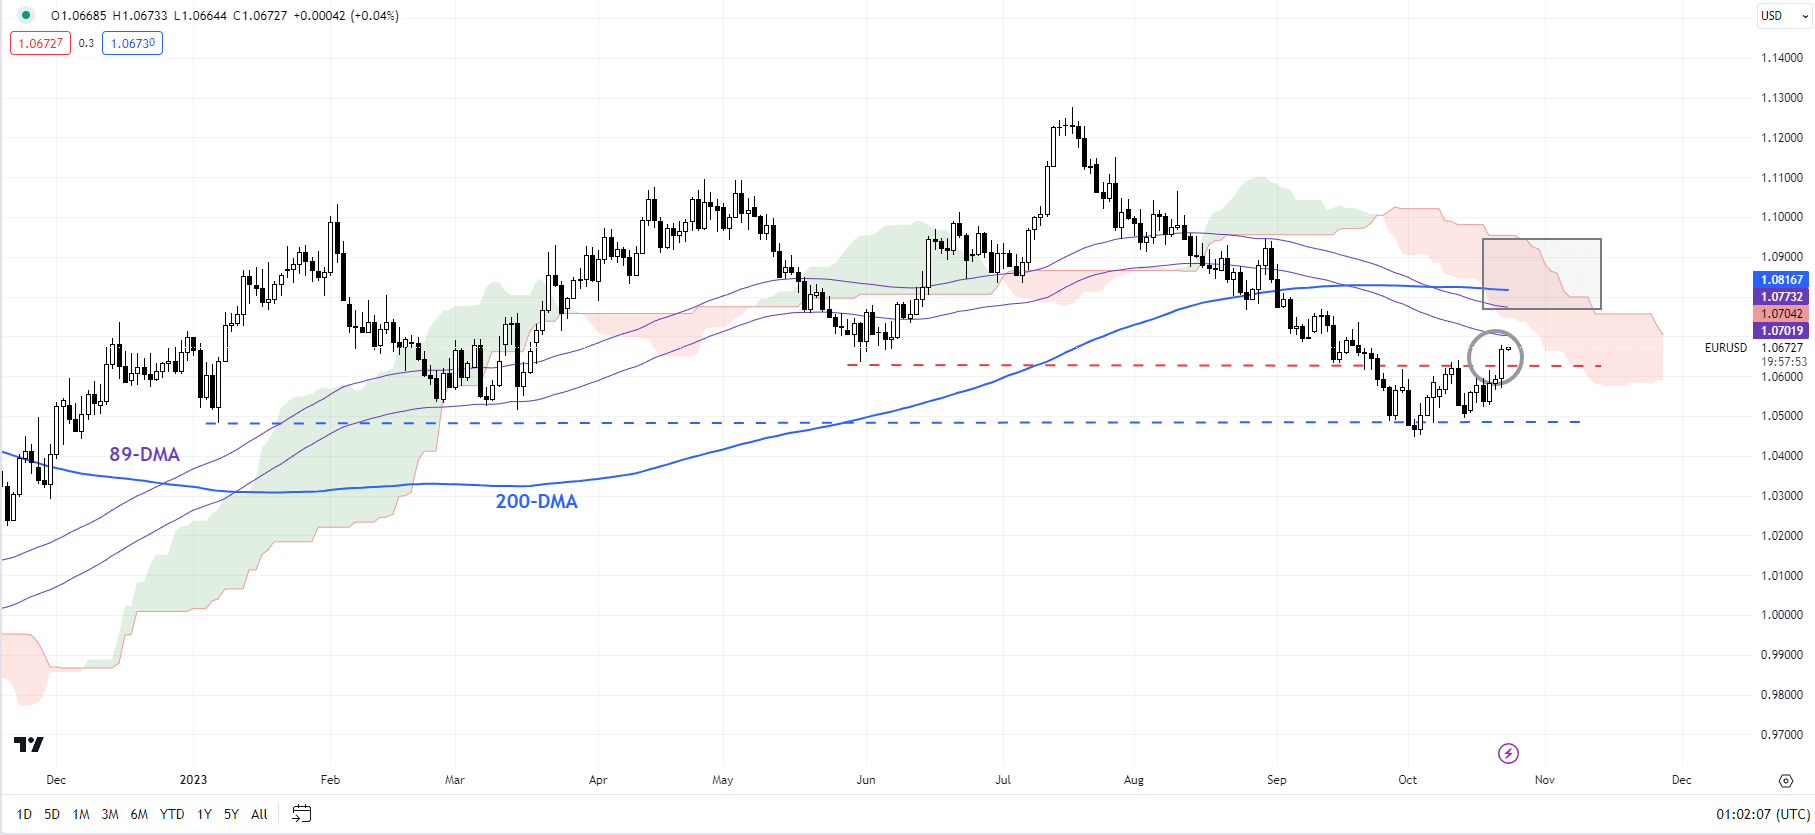
Chart Created by Manish Jaradi Using TradingView
EUR/USD: Breaks above minor resistance
EUR/USD has broken above minor resistance at the October 11 high of 1.0635 suggesting that the immediate downward pressure has faded a bit. This follows a rebound from a strong cushion at the January low of 1.0480 - a break below would have posed a serious threat to the medium-term uptrend that started late last year. EUR/USD’s rebound could extend a bit further toward the 200-day moving average (now at about 1.0825), roughly coinciding with the 89-day moving average (now at about 1.0725).
If you're puzzled by trading losses, why not take a step in the right direction? Download our guide, "Traits of Successful Traders," and gain valuable insights to steer clear of common pitfalls that can lead to costly errors.

GBP/USD Weekly Chart
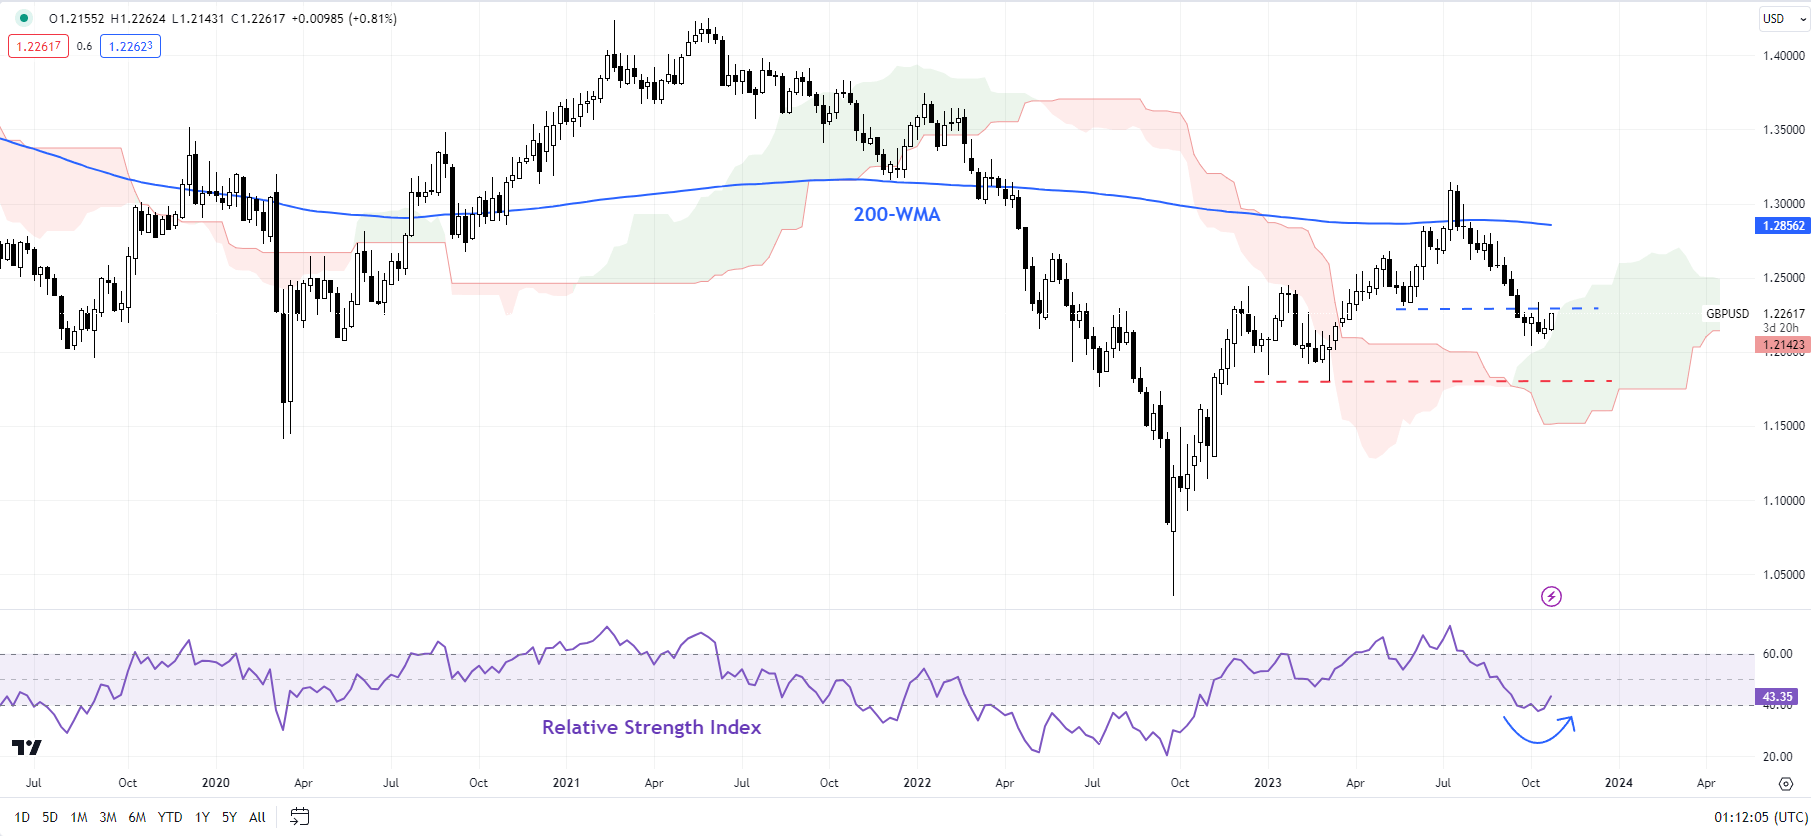
Chart Created by Manish Jaradi Using TradingView
GBPUSD: Slide pauses
GBP/USD’s slide has paused as it approaches significant support at the March low of 1.1800. Given oversold conditions, and light positioning, a minor rebound wouldn’t be surprising. Any break above the initial resistance at the October 11 high of 1.2350 could open the way toward the 200-day moving average (now at about 1.2450). Zooming out, the retreat in July from the 200-week moving average and the subsequent sharp decline raises the odds that the retracement is the correction of the rally that started a year ago. For more discussion, see “Pound’s Resilience Masks Broader Fatigue: GBP/USD, EUR/GBP, GBP/JPY Setups,” published August 23.
USD/JPY Daily Chart
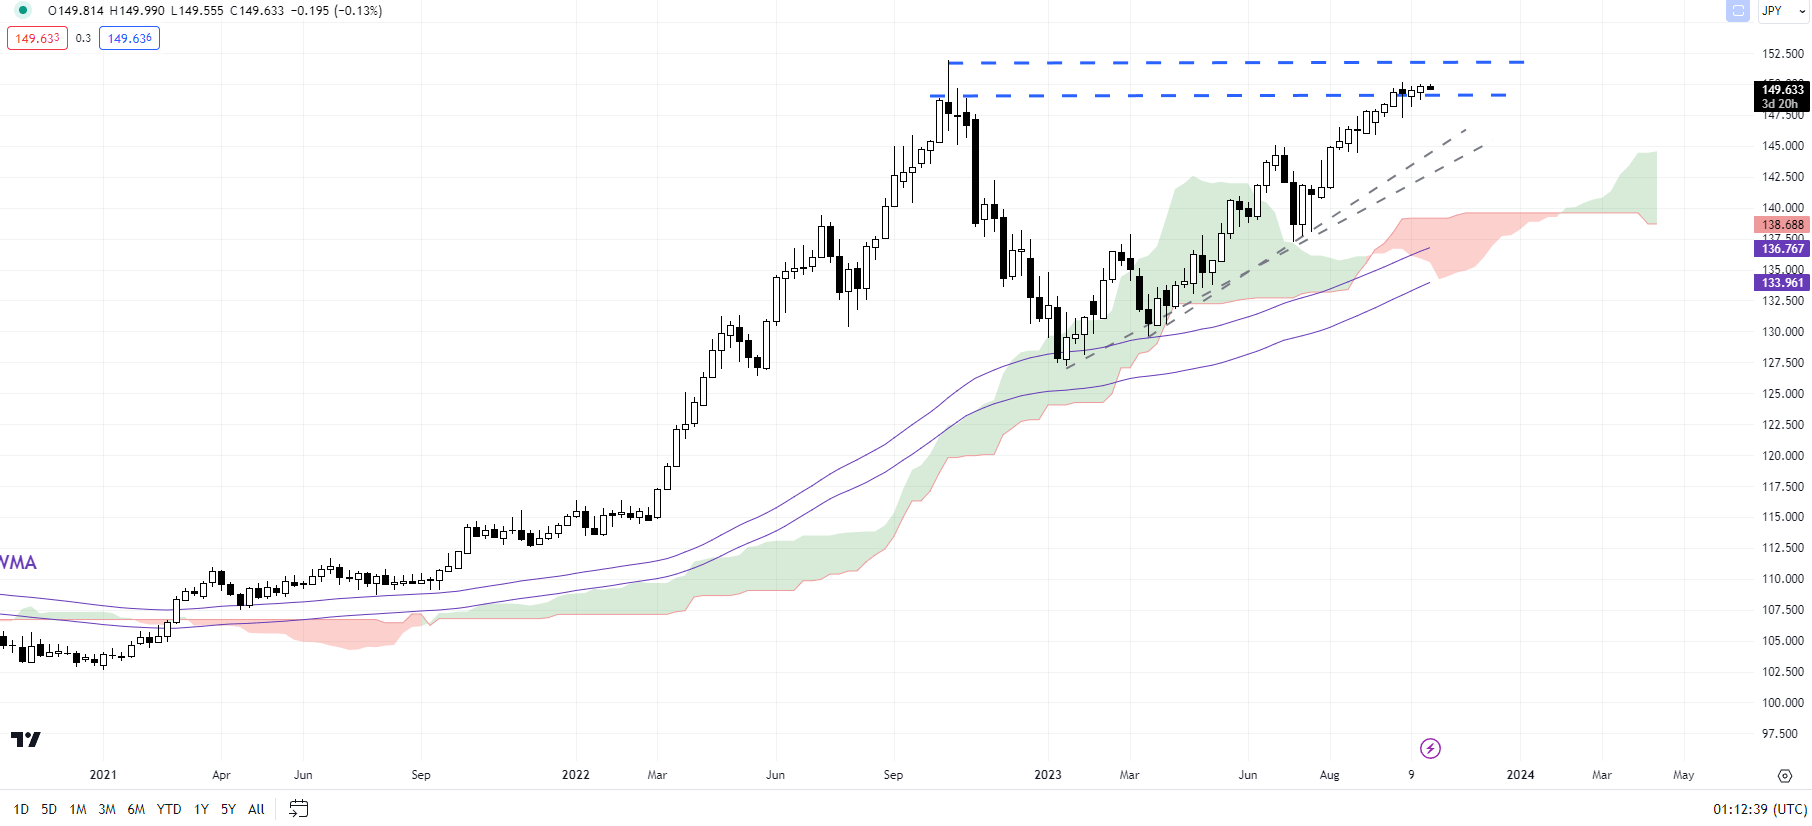
Chart Created by Manish Jaradi Using TradingView
USD/JPY: Holds below the psychological 150 mark
USD/JPY’s rally is showing signs of fatigue as it tests the psychological barrier at 150, not too far from the 2022 high of 152.00. There is a chance of a minor retreat, initially toward the Oct. 10 low of 148.25. Beyond that, a crack under the early-October low of 147.25 would be required to confirm that the multi-week upward pressure had faded. For more discussion, see “Japanese Yen After BOJ: What Has Changed in USD/JPY, EUR/JPY, AUD/JPY?” published September 25.
AUD/USD Daily Chart
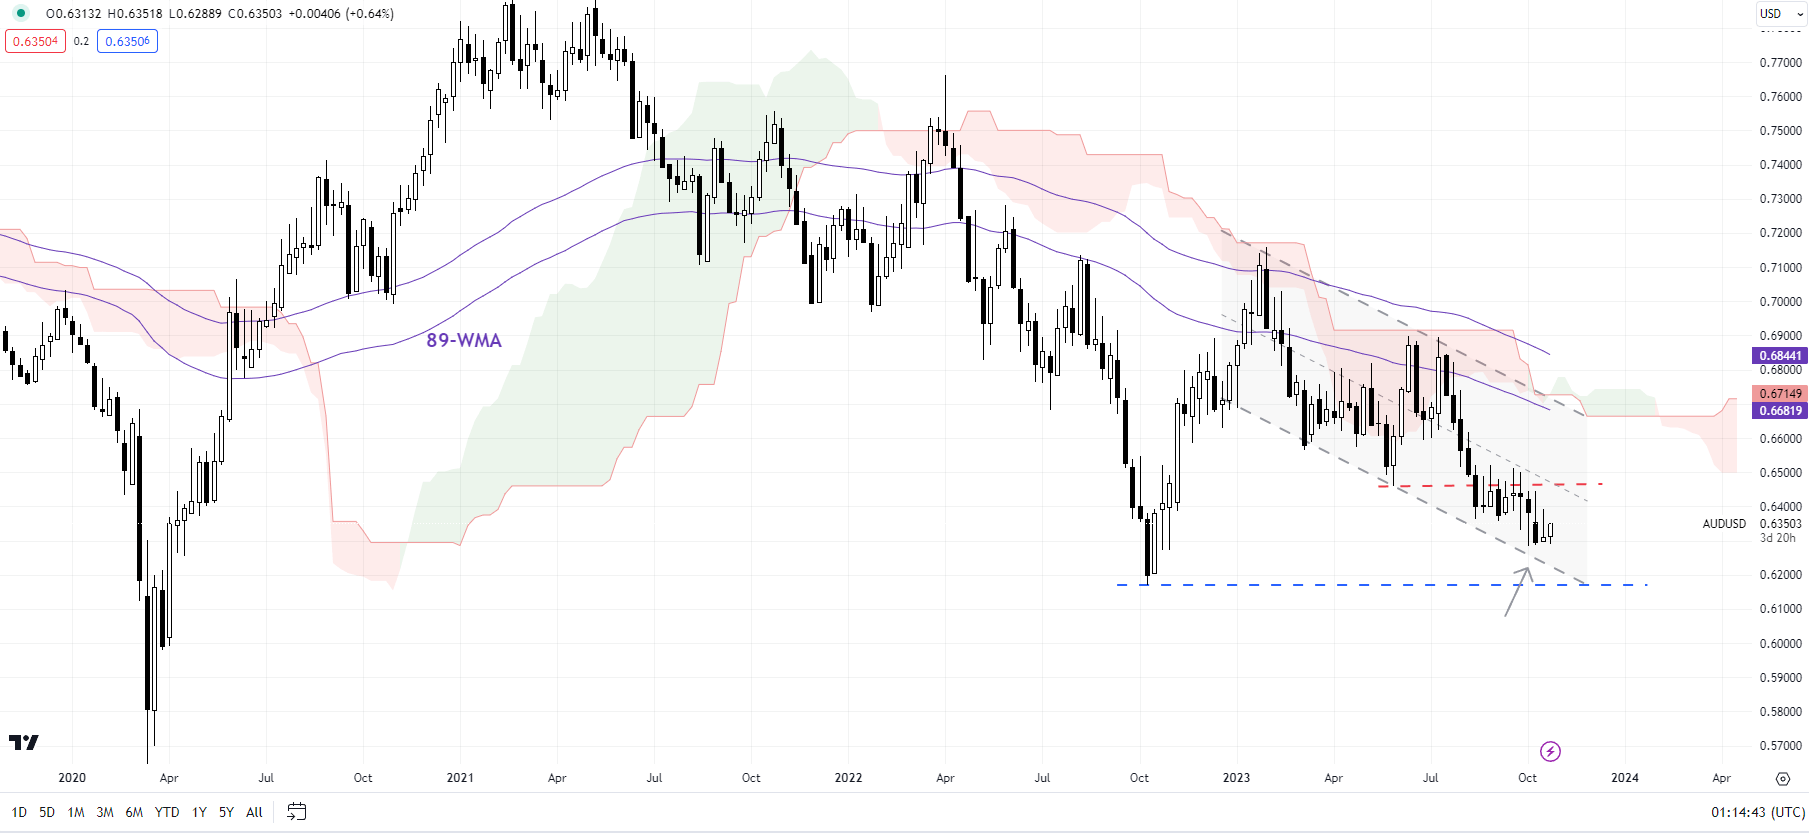
Chart Created by Manish Jaradi Using TradingView
AUD/USD: Attempting to set a low
AUD/USDis attempting to form a low but lacks the required upward momentum yet. The pair has been holding above support on the lower edge of a declining channel since August, around minor support at the early-October low of 0.6285. AUD/USD would need to break above resistance at the end-August high of 0.6525 for the immediate downward pressure to dissipate. For more discussion, including fundamentals, see “Australian Dollar Jumps After China GDP Beat; What’s Next for AUD/USD?” published October 18.
Looking for actionable trading ideas? Download our top trading opportunities guide packed with insightful tips for the fourth quarter!

--- Written by Manish Jaradi, Strategist for DailyFX.com
--- Contact and follow Jaradi on Twitter: @JaradiManish


