


Gold Price (XAU/USD) Analysis, Price, and Chart
- Gold may struggle to break back above $1,900/oz. ahead of the Jackson Hole Symposium.
- Robust US Treasury yields are reinforcing the US dollar.

Gold remains at lows last seen in mid-March and faces further potential losses if Fed chair Jerome Powell uses the Jackson Hole Symposium to once again reiterate that the central bank is fully focused on bringing inflation to heel.
The annual central banker meet-up is being held between August 24 and 26 and is titled ‘Structural Shifts in the Global Economy’ and will include a keynote speech by Fed chair Powell. At last year’s symposium, chair Powell at his annual address stated that the central bank would use their tools ‘forcefully’ to rein in inflation and that ‘Price stability….serves as the bedrock of our economy’ and that ‘without price stability, the economy does not work for anyone’. When chair Powell made those remarks last year, the Fed Fund rate was 2.25% - 2.50%. Fed Funds are currently 5.25% - 5.5%. Current CME FedFund probabilities show US rates remaining unchanged until the first cut is made in May next year.

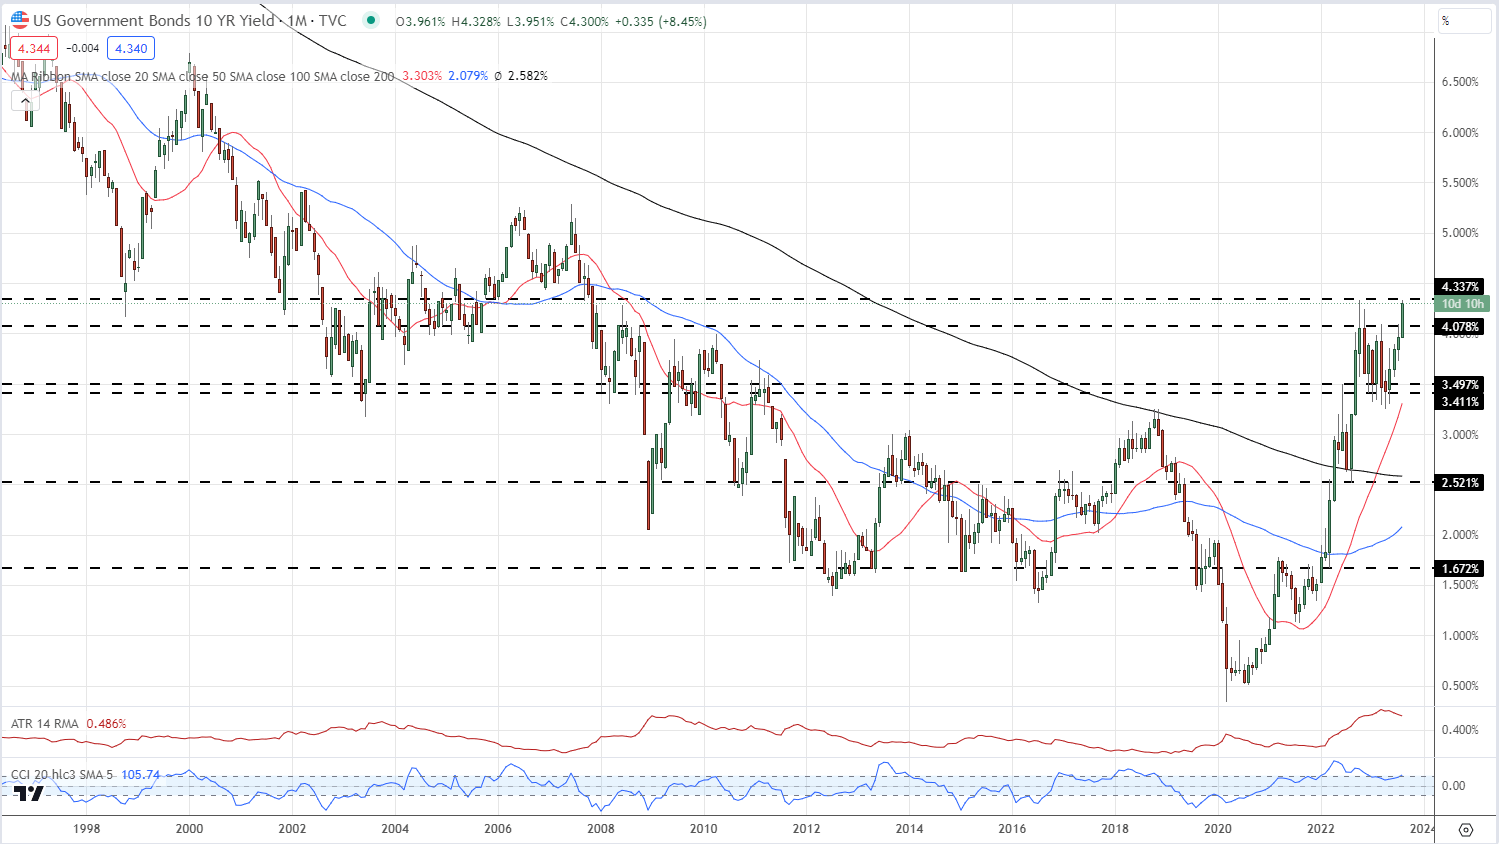
US Treasury yields remain elevated on this higher for longer Fed Fund outlook with longer-dated UST yields also being pushed higher by supply issues. According to a recent report in the South China Morning Post citing data from the US Treasury, China reduced its UST holdings by US$11.3 billion in June, its third consecutive monthly cut. China has also reduced its UST holdings by US$103 billion in the last year to June, around 11% of its total holdings. Over the same time period, Japan also sold US$127 billion USTs.
Looking at the UST 10-year, a break above 4.337% would see yields back to levels last seen in November 2007.
US 10-Year Yield – Monthly Chart
Gold is little changed to start the week and remains below $1,900/oz. Last week’s break below the 200-dma – currently at $1,905/oz. - added to the chart's negative outlook, while the 20-dma slipping below the 50-dma also highlights the precious metals current weakness. A 50% retracement of the November 2022-May 2023 rally is seen at $1,849/oz.
Gold Daily Price Chart – August 21, 2023
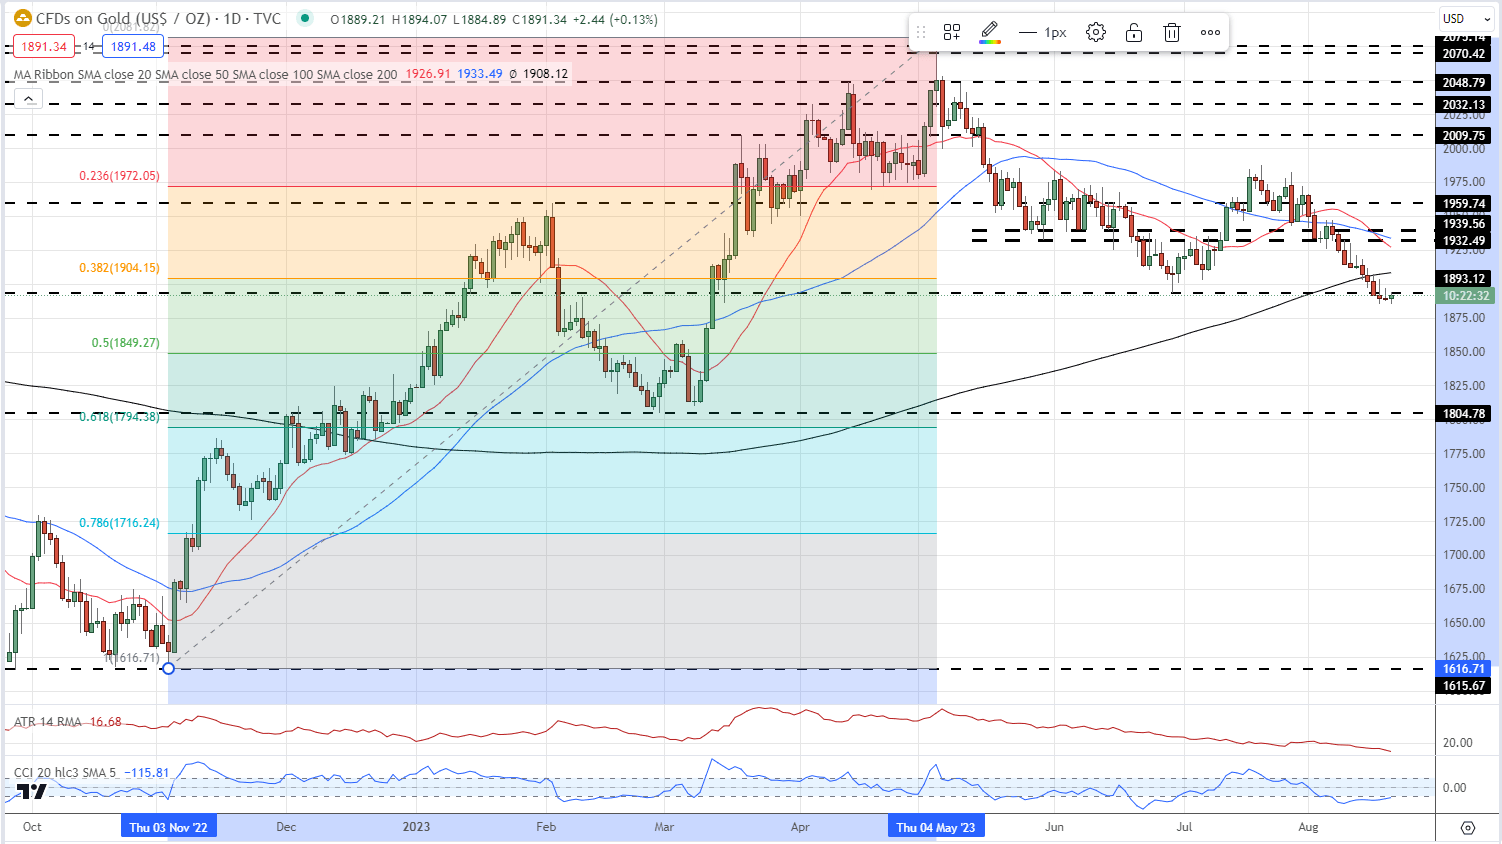
Chart via TradingView
Retail trader data shows 80.65% of traders are net-long with the ratio of traders long to short at 4.17 to 1.
Learn how changes in client sentiment can change gold's outlook.
| Change in | Longs | Shorts | OI |
| Daily | 19% | -12% | 4% |
| Weekly | 11% | -7% | 3% |
What is your view on Gold – bullish or bearish?? You can let us know via the form at the end of this piece or you can contact the author via Twitter @nickcawley1.


