


Gold Price (XAU/USD) Analysis, Price, and Chart
- US dollar weakness helps to power gold higher.
- Retail sentiment is mixed.

For all market-moving data releases and events, see the DailyFX Economic Calendar
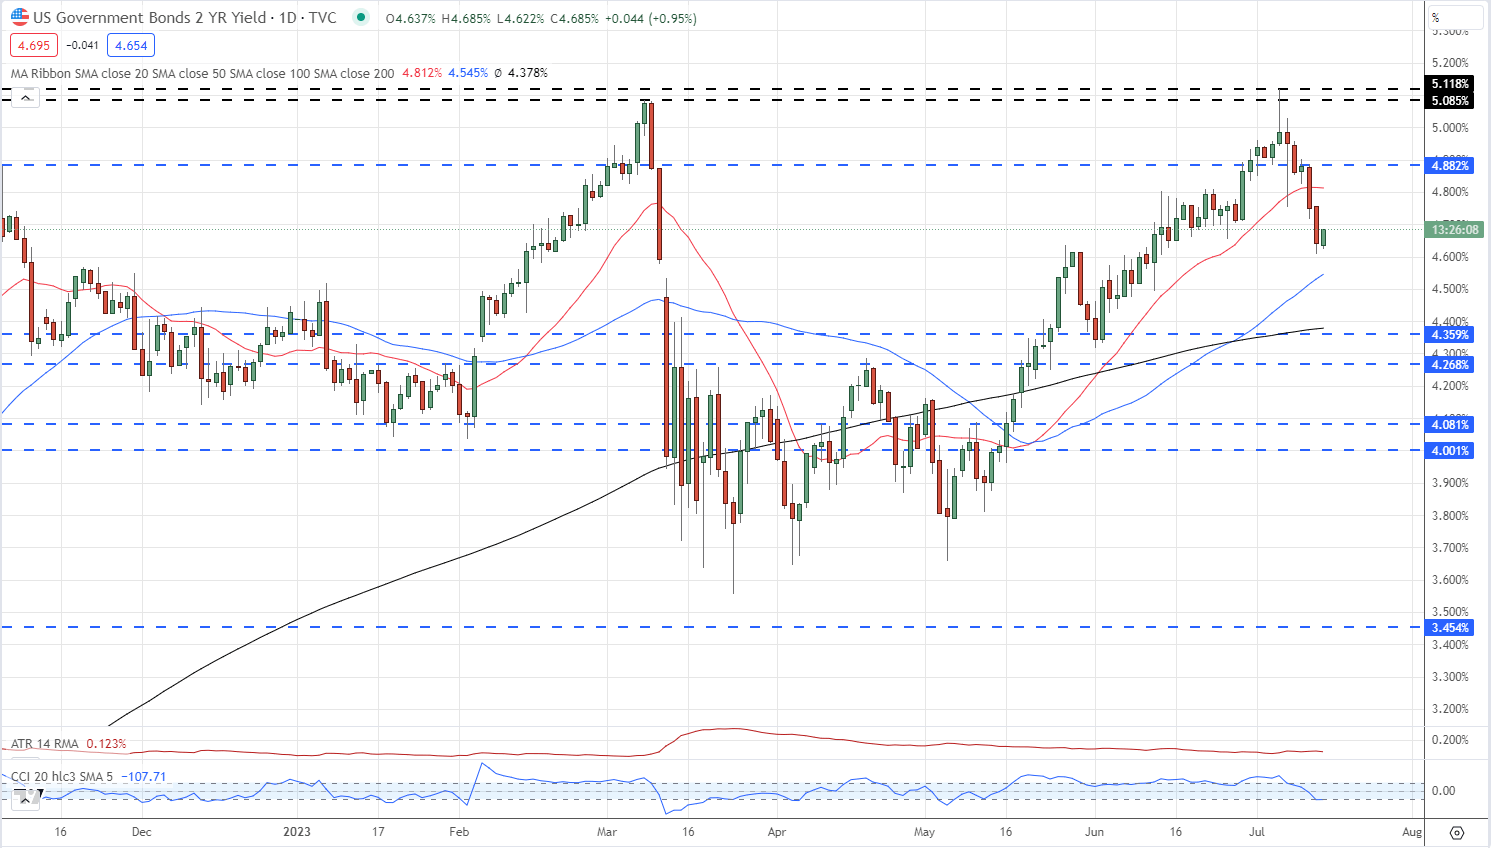
US Treasury yields have fallen sharply over the last week as traders increase their bets that the Federal Reserve’s monetary policy tightening program is coming to an end. The yield on the rate-sensitive UST 2s has fallen by 50 basis points since last Thursday, while further out along the curve, the UST 10s are around 30 basis points lower, while the UST 30s have shed around 18 basis points over the same time period. In the short end at least, it looks as though we have passed peak rates.
UST 2-Year Yield Daily Chart
The tailwind of lower rates has helped push gold through a zone of support turned resistance around $1932/oz. and $1.940/oz. This area now turns back to support and should hold any short-tend sell-off. Below here the 20-day simple moving average acts as further support. To the upside, $1971/oz. and $1,985/oz. should act as brakes to any move higher.

Gold Daily Price Chart – July 14, 2023
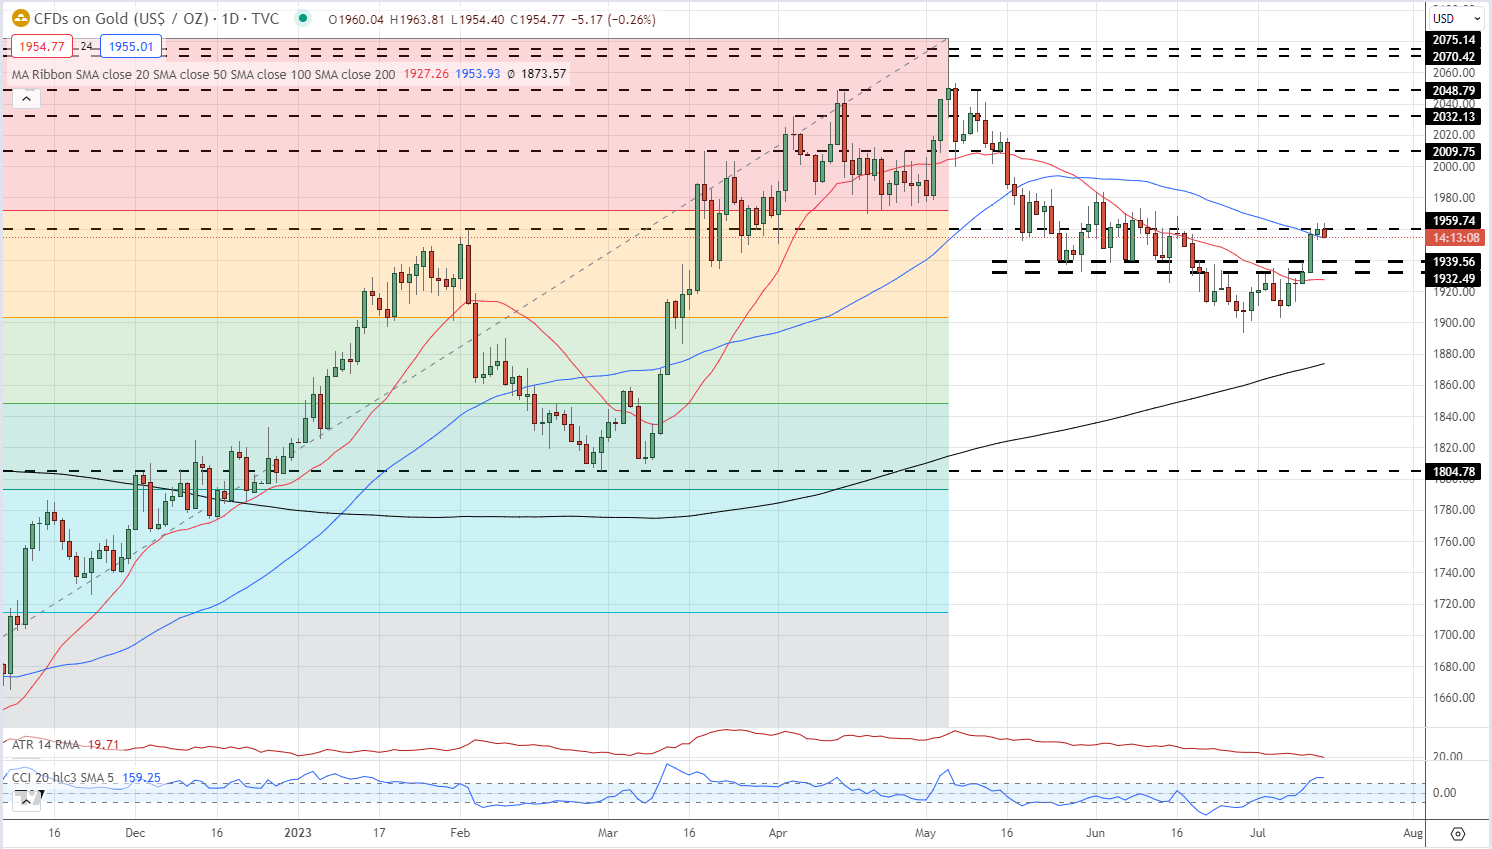
Chart via TradingView
| Change in | Longs | Shorts | OI |
| Daily | -7% | 9% | 0% |
| Weekly | -7% | 18% | 4% |
Retail Traders Remain Long of Gold but Sentiment is Mixed
Retail trader data show 65.23% of traders are net-long with the ratio of traders long to short at 1.88 to 1.The number of traders net-long is 2.79% higher than yesterday and 13.82% lower than last week, while the number of traders net-short is 5.32% lower than yesterday and 41.56% higher than last week.
We typically take a contrarian view to crowd sentiment, and the fact traders are net-long suggests Gold prices may continue to fall. Positioning is more net-long than yesterday but less net-long from last week. The combination of current sentiment and recent changes gives us a further mixed Gold trading bias.
What is your view on Gold – bullish or bearish?? You can let us know via the form at the end of this piece or you can contact the author via Twitter @nickcawley1.


