


Gold Price (XAU/USD), Silver Price (XAG/USD) Analysis, Price, and Chart

US Treasury yields turned sharply lower at the end of last week after the latest US Jobs Report showed hiring slowing down in July. The US economy added 187k new jobs, missing expectations of 200k, while the June number was revised lower to 185k from 209k.
July Jobs Report: Payrolls Rise by 187k, Driving Action in Gold, US Dollar
Last Friday’s yield sell-off however has proved short-lived with longer-dated US Treasury pushing higher today. Traders are still worried that US inflation may prove difficult to bring back to target, while the US Treasury will start its latest quarterly refunding tomorrow with $102 billion of bond sales planned. On Tuesday $42 billion 3 years and $38 billion 10 years will be put up for sale, while on Wednesday $23 billion 30 years will hit the street. Today’s push higher in UST yields may be a reflection of traders trying to get more yield for their money.

Gold is sitting on a prior level of support but remains within a longer-dated trading range of $1,893/oz. and $1,993/oz as gold’s volatility remains at, or close to, multi-month lows. This three-month range has held repeated attempts to break higher and lower and with little in the way of macro news until the US inflation data on Thursday, this range will likely remain intact.
Gold Daily Price Chart – August 7, 2023
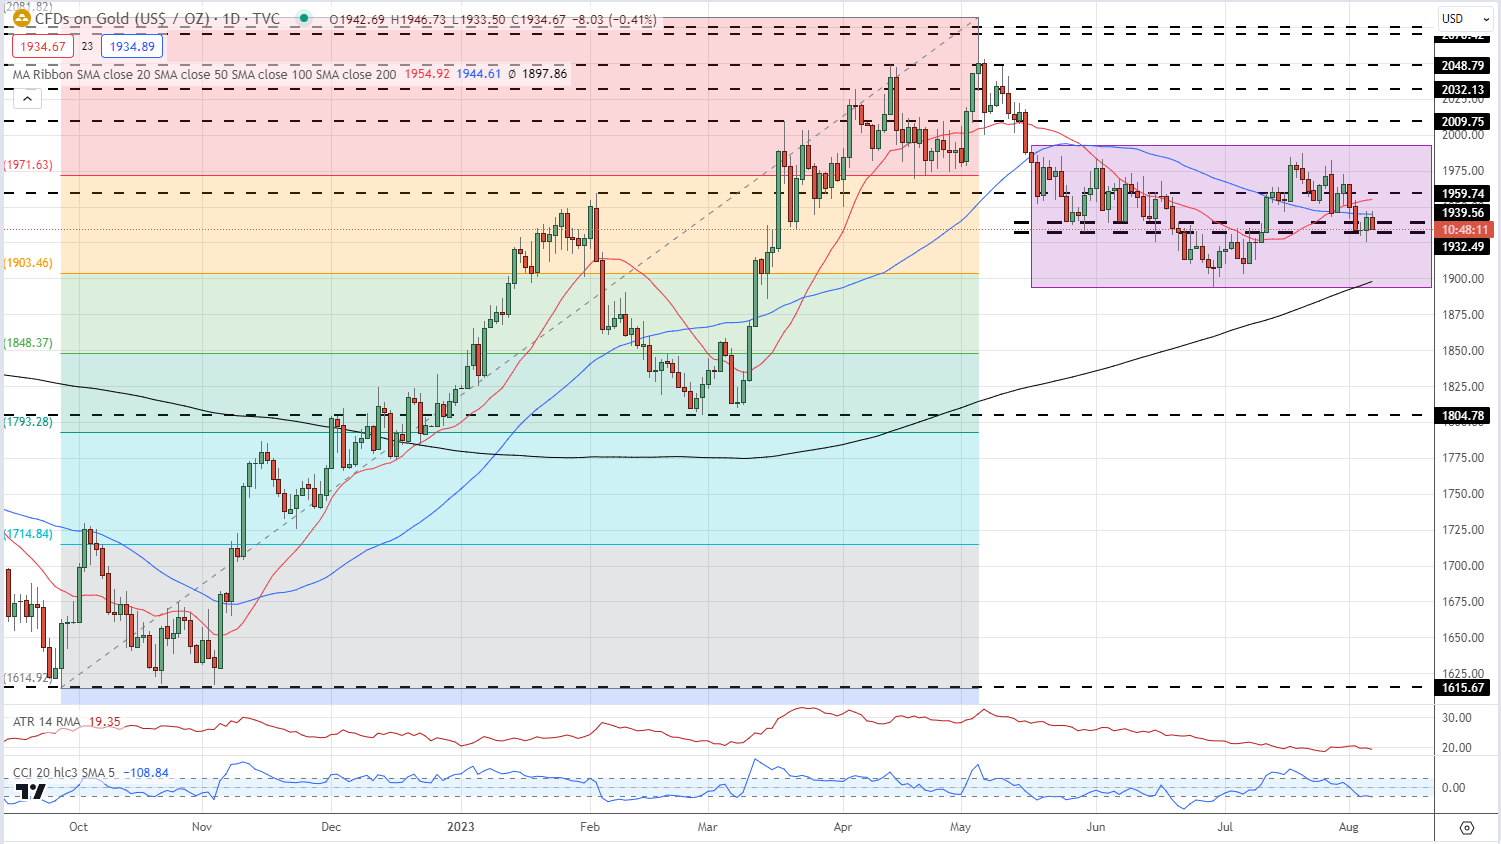
Chart via TradingView
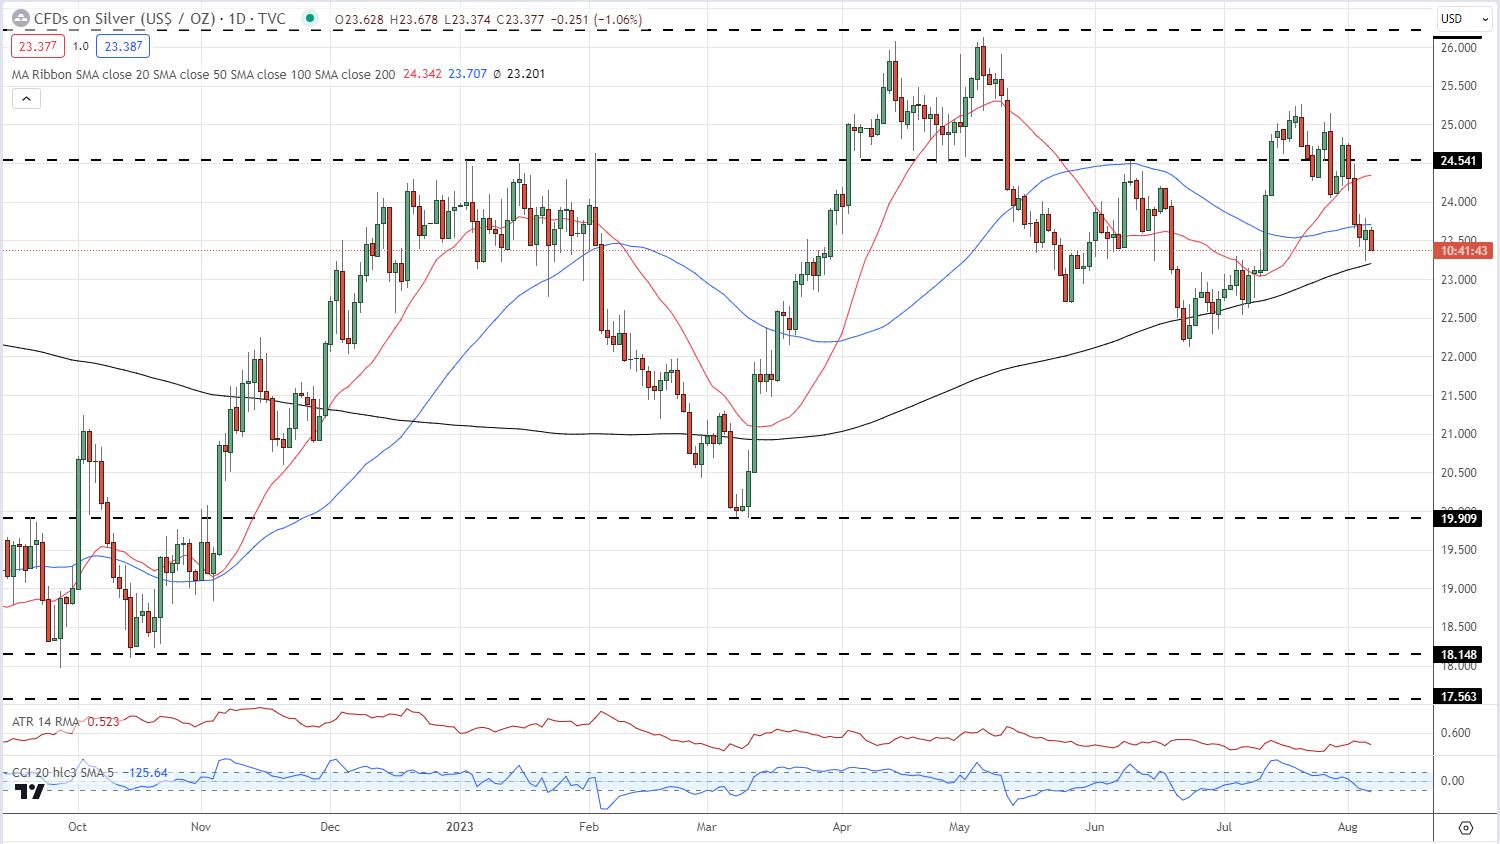
The daily silver chart is marginally more volatile than its peer golds. The 14-day ATR reading is higher than gold, while the CCI indicator shows silver sitting in oversold territory for the first time since late June. Initial support may be seen off the 200-day simple average, currently at $23.20, while some previous price action around $23.10 should add support. A sustained sell-off would bring the June 23 low at $22.12 into play.
Silver Daily Price Chart – August 7, 2023
Gold and Silver Client Sentiment
Retail traders are 75.4% net-long in gold and 86.1% net-long in silver.
Download the latest sentiment guides (below) to see how daily and weekly positional changes affect the pair’s sentiment and outlook.
| Change in | Longs | Shorts | OI |
| Daily | 17% | -8% | 4% |
| Weekly | -7% | 13% | 1% |
What is your view on Gold and Silver – bullish or bearish?? You can let us know via the form at the end of this piece or you can contact the author via Twitter @nickcawley1.


