


Gold, XAU/USD, Jerome Powell Testimony, Technical Analysis - Briefing:
- Gold prices fell on Monday as Treasury yields rose
- Traders eagerly awaiting Jerome Powell’s testimony
- Bearish Death Cross in focus on the daily setting

Gold prices aimed cautiously lower on Monday. The anti-fiat yellow metal inversely tracked Treasury yields. The 2-year government bond rate rallied by 0.6%. XAU/USD can be quite sensitive to Treasuries, which are partly a reflection of monetary policy expectations. This is due to gold’s inherent lack of yield when holding the precious metal. When the return on cash rises, XAU tends to fall and vice versa.
Financial markets are eagerly awaiting testimony from Federal Reserve Chair Jerome Powell before the Senate and House committees, which starts later today. Traders will be tuning in to see if he has more specifics about just how restrictive monetary policy will be in the near term. In recent weeks, markets increased rate hike expectations, bringing the anticipated rate to 5.5% by year-end.
Recent inflation data (both CPI and the Fed’s preferred PCE gauge) surprised higher, hinting at stickier price pressures. That may require a tighter central bank for longer. Such an outcome would likely not bode well for gold. During the early Tuesday Asia trading session, gold was attempting to push higher. But, follow-through might have to wait until we are past the first round of testimony from Jerome Powell.
XAU/USD Daily Chart
Looking at the daily chart, gold remains above the 20-day Simple Moving Average, but below the 50-day line. In recent days, a bearish Death Cross emerged between these two lines, offering an increasingly downside technical bias. Dropping back under the 20-day SMA exposes the 38.2% Fibonacci retracement level at 1828 before placing the focus on the February low at 1804.78. Immediate resistance is the 23.6% level at 1878.36.

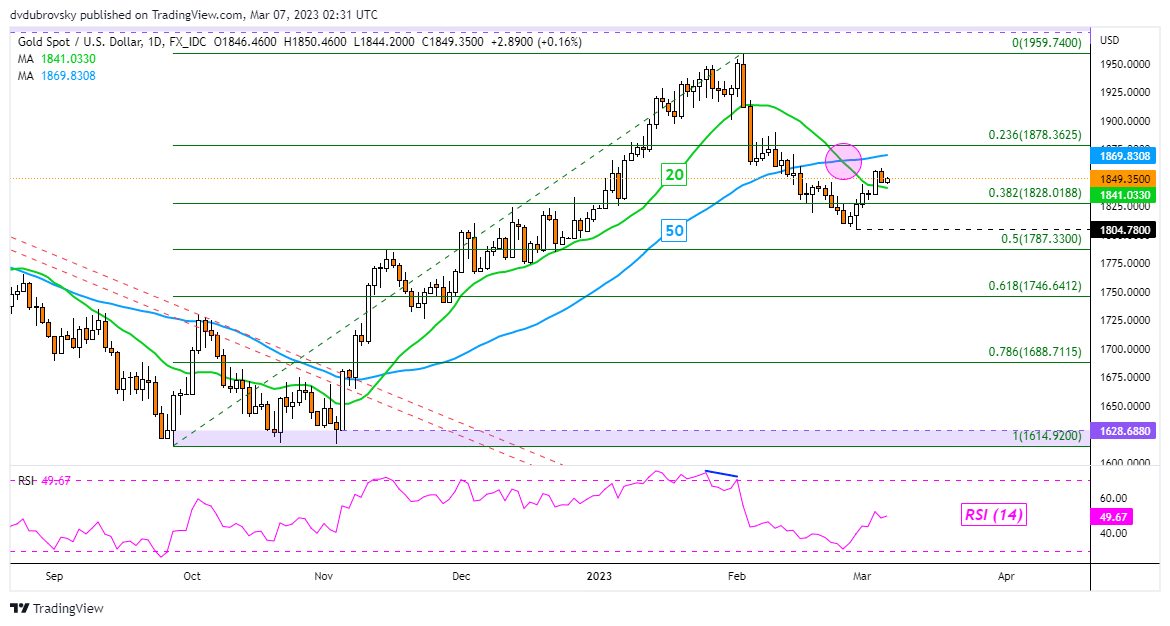
Chart Created Using TradingView
--- Written by Daniel Dubrovsky, Senior Strategist for DailyFX.com
To contact Daniel, follow him on Twitter:@ddubrovskyFX


