


Gold Price (XAU/USD) Analysis, Price, and Chart

For all market-moving data releases and events, see the DailyFX Economic Calendar
The precious metal is having a quiet start to the week with spot gold trading on either side of $1,920/oz. so far today. Gold volatility is currently sitting at a multi-month low, while the CCP indicator shows that gold is neither overbought or oversold. This may change mid-week however when the latest US inflation data is released. US core inflation is expected to fall to 5% from 5.3% in May y/y, while headline inflation is seen falling to 3.1% from 4% last month. Headline inflation hit a multi-decade high rate of 9.1% in June last year. A sharp fall in inflation, if it happens, would take the pressure off the Federal Reserve to tighten monetary policy further.
US Headline Inflation
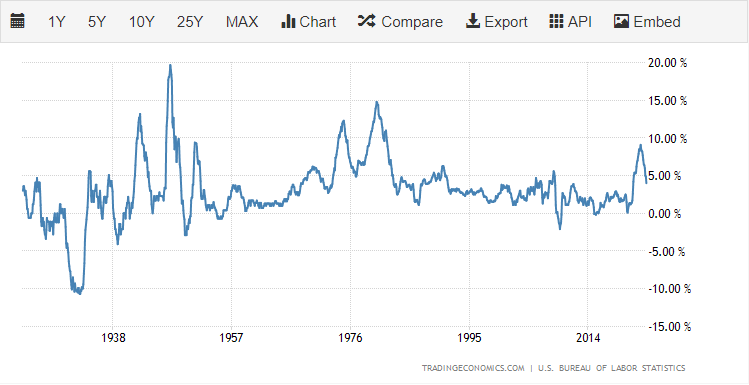
Chart via Trading Economics.

Gold remains trapped below a zone of resistance between $1,933/oz. and $1,940/oz. This short-term zone has held gold at bay for the last month with each attempted break higher thwarted as sellers reappear. The downward-sloping 20-day simple moving average, currently at $1.926.61, is also pushing down on the price of gold. Support is provided by the 38.2% Fibonacci retracement level at $1,903/oz and by the big figure $1,900/oz. price point. Below here sits the 200-dma at $1,868.76.
Gold Daily Price Chart – July 10, 2023
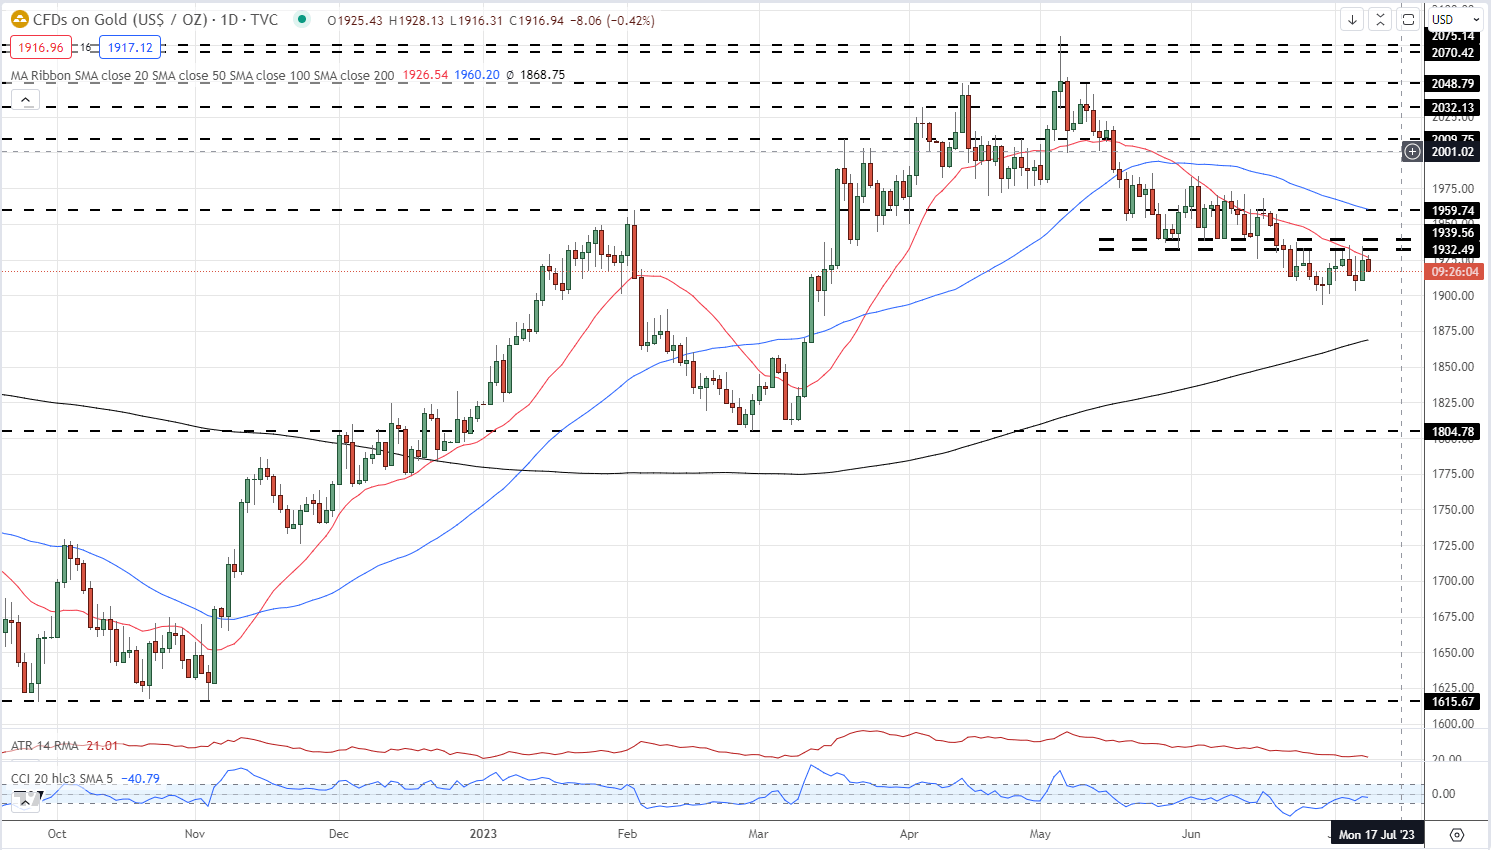
Chart via TradingView
| Change in | Longs | Shorts | OI |
| Daily | 22% | -12% | 5% |
| Weekly | 12% | -6% | 4% |
Retail Traders Remain Long of Gold
Retail trader data show 70.49% of traders are net-long with the ratio of traders long to short at 2.39 to 1.The number of traders net-long is 6.02% higher than yesterday and 6.22% lower than last week, while the number of traders net-short is 6.79% higher than yesterday and 9.53% higher than last week.
We typically take a contrarian view to crowd sentiment, and the fact traders are net-long suggests Gold prices may continue to fall. Yet traders are less net-long than yesterday and compared with last week. Recent changes in sentiment warn that the current Gold price trend may soon reverse higher despite the fact traders remain net-long.
What is your view on Gold – bullish or bearish?? You can let us know via the form at the end of this piece or you can contact the author via Twitter @nickcawley1.


