


Gold, XAU/USD, US Dollar, DXY Index, Fitch, AA+, Treasury Yields, GVZ - Talking Points
- The gold price appears directionless despite moves in other markets
- The Fitch announcement might see pressure on risk assets and haven asset tailwinds
- If volatility emerges in the gold price, will it help or hinder the precious metal?

The gold price steadied into the Asian session on Wednesday after a selloff into the New York close overnight.
The price action comes after Fitch, a large credit rating agency, downgraded the US sovereign debt credit rating to AA+ from AAA.
The agency “expected fiscal deterioration over the next three years, a high and growing general government debt burden, and the erosion of governance relative to ‘AA’ and ‘AAA’ rated peers over the last two decades,”
Ironically in early trade, Treasuries rallied in price and yields dipped as risk aversion appeared to outweigh the implication for US Government borrowing costs.
However, yields had made notable gains in the US session with the benchmark 10-year note trading near 4.06% before dipping toward 4.0% today.
The announcement from Fitch came after the close of the Wall Street cash session, but futures are moving lower in the aftermath. APAC equities are similarly priced in a soft day ahead.
If the theme of risk aversion continues throughout the day, then gold might see an uptick in volatility.
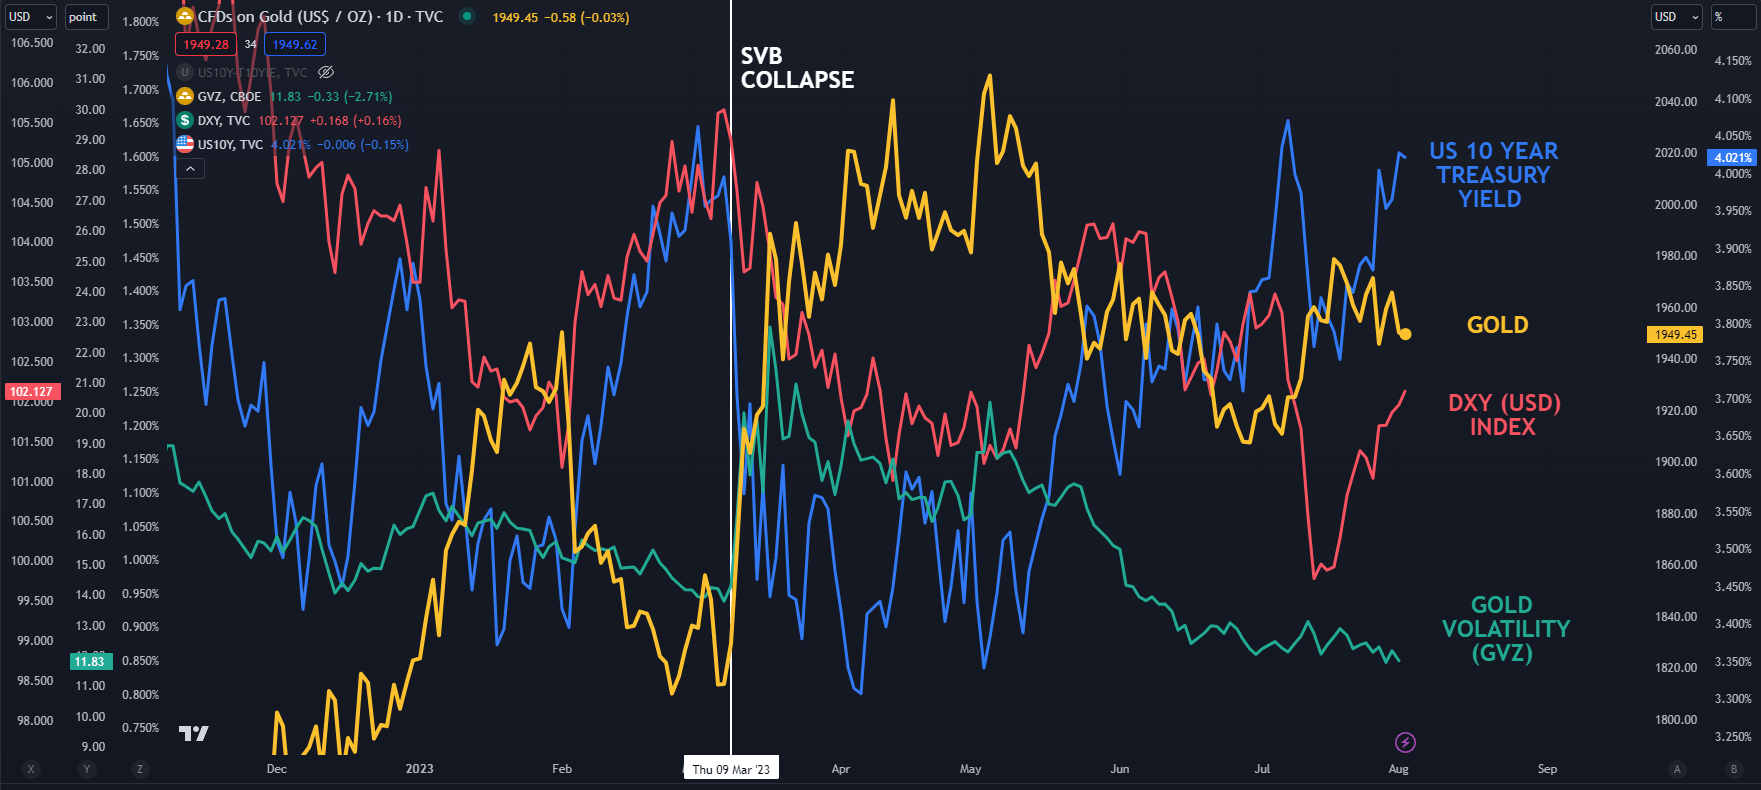
The GVZ index is a measure of implied volatility for gold that is calculated in a similar way to the VIX index’s interpretation of volatility for the S&P 500. Gold volatility has been languishing and might indicate a lack of conviction for direction in price.
US Dollar gyrations may also impact the gold price.

SPOT GOLD AGAINST US 10-YEAR TREASURY YIELD, DXY (USD) INDEX AND GVZ INDEX
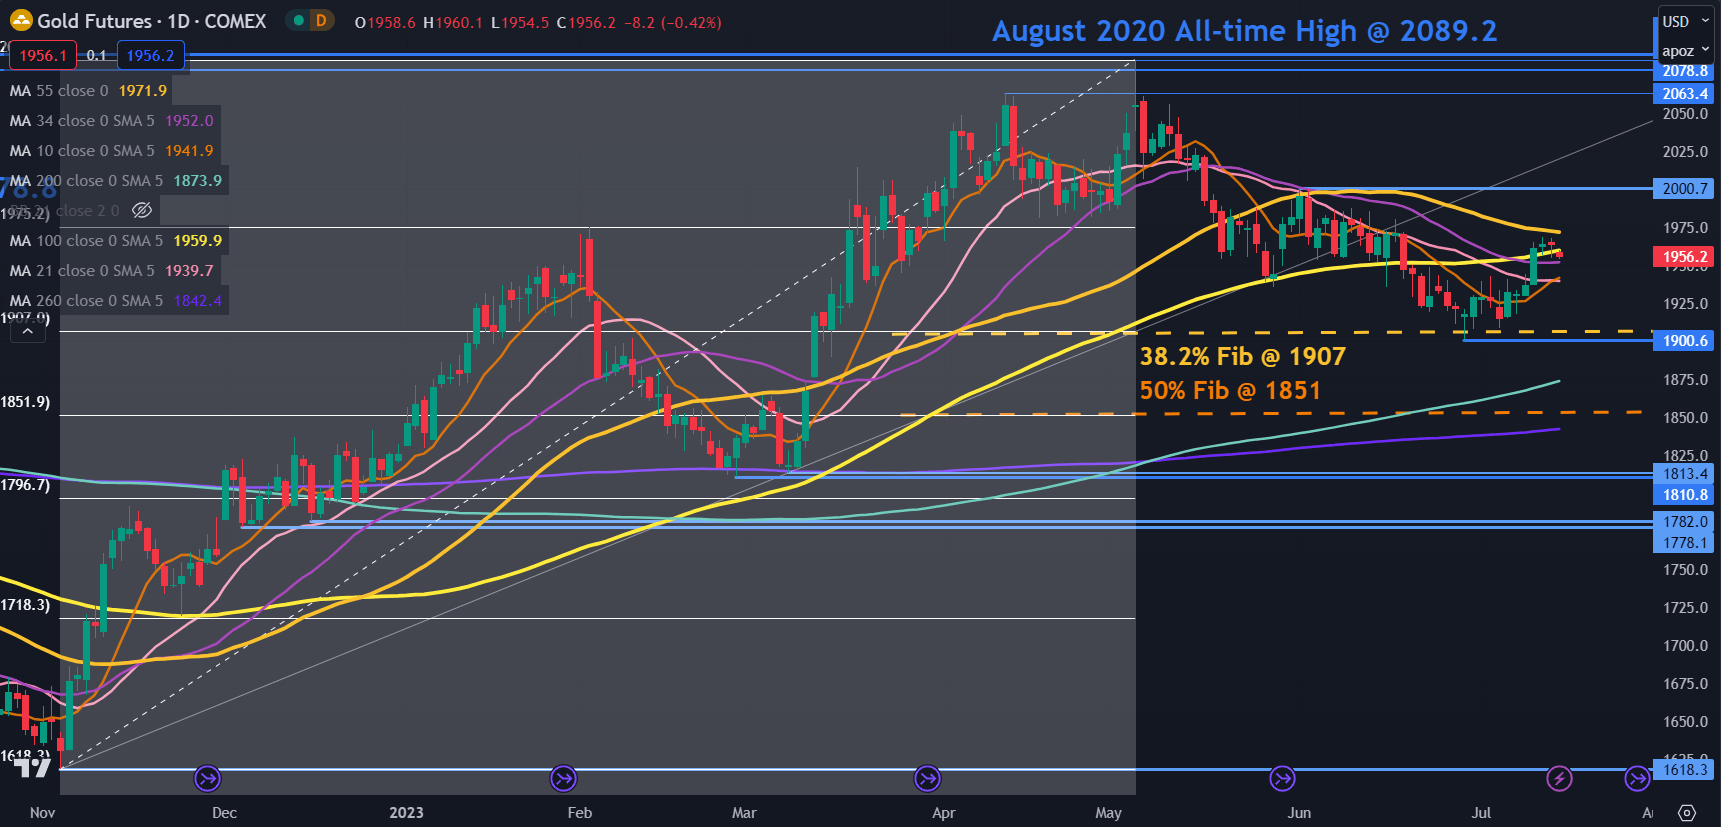
GOLD TECHNICAL ANALYSIS
The gold price remains near the middle of its almost 5-month range between 1885 and 2062. It also lies close to the 10-, 21-, 34-, 100-day simple moving averages (SMA) which may imply a lack of directional confidence in the gold market.
The lower bound of the range could see notable support lie in the 1885 – 1895 area.
In that zone, there are a couple of prior lows, a breakpoint, the 200-day SMA and the 38.2% Fibonacci Retracement level of the move from 1614 up to 2062.
Further down the 50% Fibonacci Retracement at 1838 might lend support.
On the topside, resistance might be at the recent peak of 1897 or the breakpoint near 2000.
--- Written by Daniel McCarthy, Strategist for DailyFX.com
Please contact Daniel via @DanMcCathyFX on Twitter


