


Gold, XAU/USD, ISM Prices Paid, Technical Analysis - Briefing:
- Gold’s rally on Wednesday could become relatively short-lived
- Higher US ISM prices paid data boosted Fed rate hike estimates
- XAU/USD restrained by the 20-day SMA, reinforcing resistance

Even though gold prices aimed higher on Wednesday, the yellow metal might find that maintaining its momentum will be difficult. A weaker US Dollar likely helped give XAU/USD the juice it needed to squeeze out a third consecutive daily gain. Gold’s 1.35% gain this week so far is shaping up to be the best since early January.
Earlier in the day, traders were likely focused on rosy Chinese manufacturing PMI figures. The latter clocked in at 52.6 in February, much higher than the 50.6 median Bloomberg survey estimate. This also represented a push higher from January’s 50.1 outcome. Put together, this continues to paint an economy that is recovering from prolonged Covid lockdowns not long ago.
However, later in the day, US ISM Manufacturing data crossed the wires. While the headline gauge disappointed at 47.7 versus the 48.0 estimate, the prices paid gauge unexpectedly jumped to 51.3 versus 44.5 prior. This was compared to a 46.5 estimate. Overall, it meant it was the first time the figure showed rising costs since September.
Moreover, this data, coupled with recent stickier US CPI and PCE figures, continued underscoring that the world’s largest economy likely has a longer fight left with inflation. Fed Funds Futures indicated that markets priced in a peak policy rate of 5.5% in September shortly after the ISM figures. As a result, the 2-year Treasury yield jumped closer to 5%, bringing the rate closer to the 2007 high.
During Wednesday’s Asia-Pacific trading session, gold turned lower as the US Dollar regained some lost ground. Further pain might be in store for XAU/USD. Traders will turn their attention to the next round of US jobless claims data and an economic outlook speech from Federal Reserve Board Member Christopher Waller.
XAU/USD Daily Chart
On the daily chart, gold may be readying to resume the near-term downtrend since late January. A bearish Death Cross recently formed between the 20- and 50-day Simple Moving Averages (SMAs). In fact, over the past 24 hours, the 20-day line held as resistance, maintaining the downside focus. Clearing the 38.2% Fibonacci retracement level at 1828 exposes the February 28th low at 1804.78.
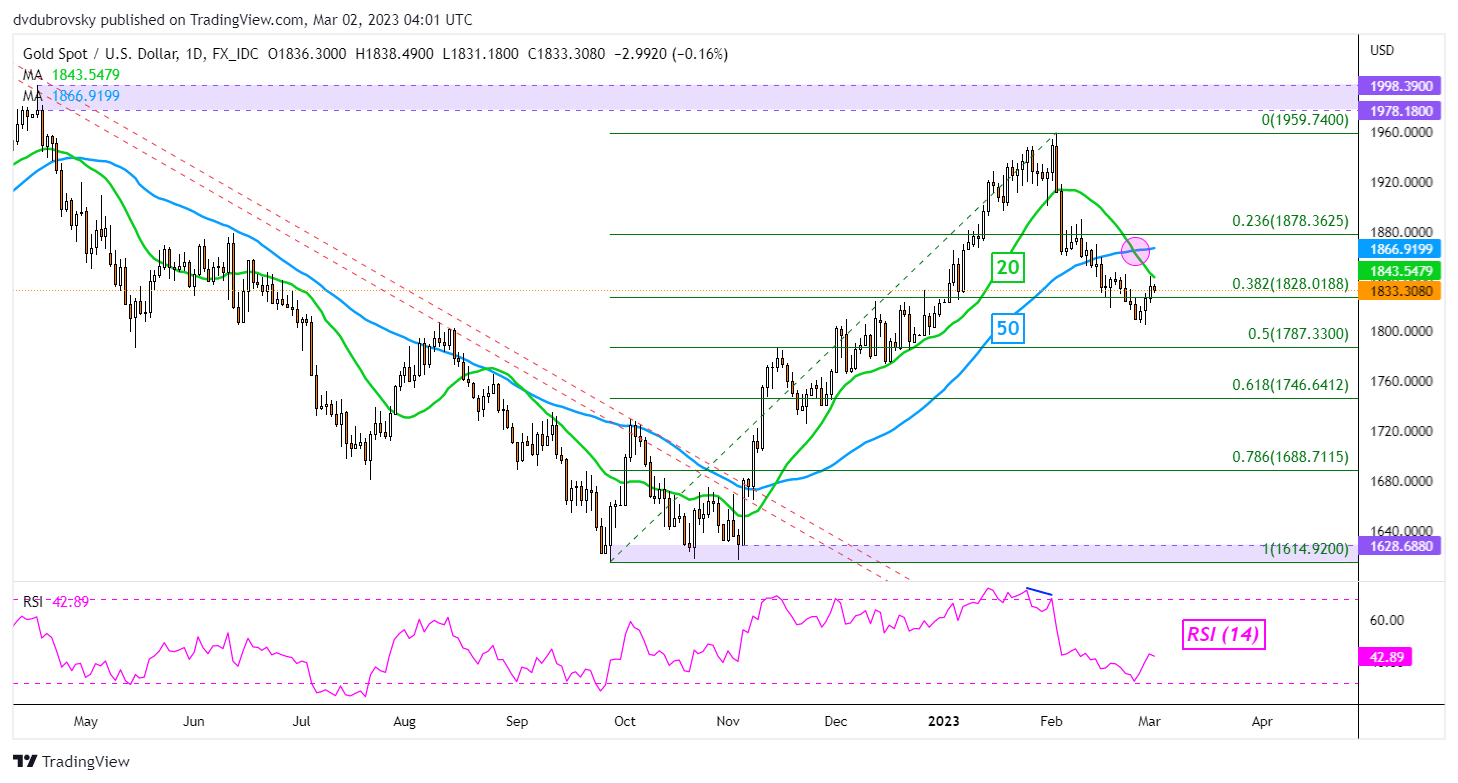
Chart Created Using TradingView
--- Written by Daniel Dubrovsky, Senior Strategist for DailyFX.com
To contact Daniel, follow him on Twitter:@ddubrovskyFX


