Gold, XAU/USD, CPI, Trendline Breakout – Precious Metals Briefing:
- Gold prices sink in the aftermath of US inflation data
- Longer-term Treasury yields outpaced the front-end
- This will continue making life difficult for XAU/USD

Gold prices weakened in the aftermath of US inflation data on Thursday, reversing upside progress accumulated during the first 12 hours of the day. Headline CPI clocked in at 3.2% y/y in July against the 3.3% consensus, which was a little softer. But, it marked an uptick from last month’s 3% outcome. Meanwhile, the core gauge weakened slightly to 4.7% y/y from 4.8%, as expected.
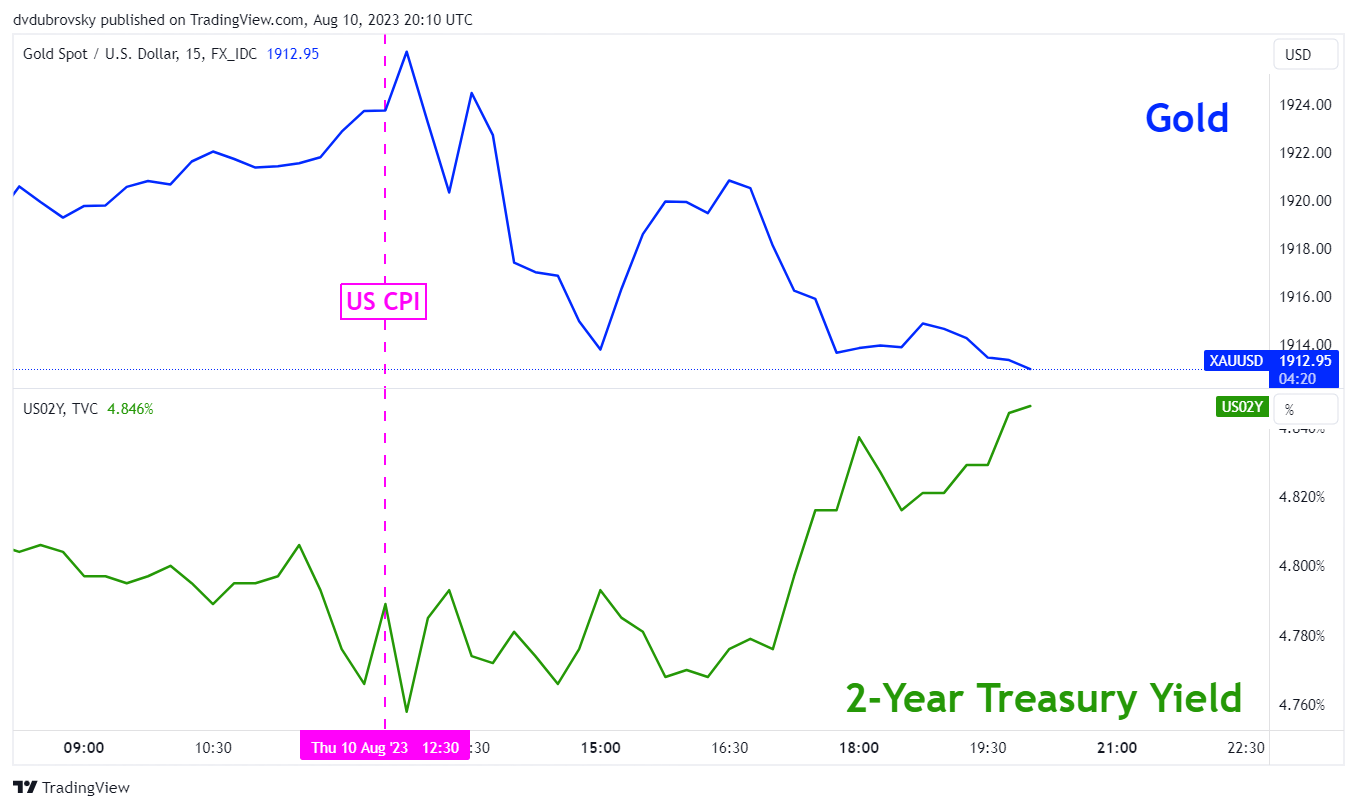
Treasury yields aimed higher as well – see chart below. A closer look at Federal Reserve monetary policy expectations reveals that while the report did little to alter near-term interest rate bets, the broader horizon looks a little bit different. The 3+ year horizon added the most tightening, which speaks to a central bank that is hawkish for longer.
During the past 24 hours, San Francisco Fed President Mary Daly mentioned that the central bank still has “more work to do”. As such, it is unsurprising to have seen longer-term Treasury rates rally the most as it reflects financial markets increasingly looking at a central bank that delays the next rate cut cycle. Gold, being the anti-fiat instrument, unsurprisingly did not fare well.
Gold and Treasury Yields After US CPI Data
Gold Technical Analysis
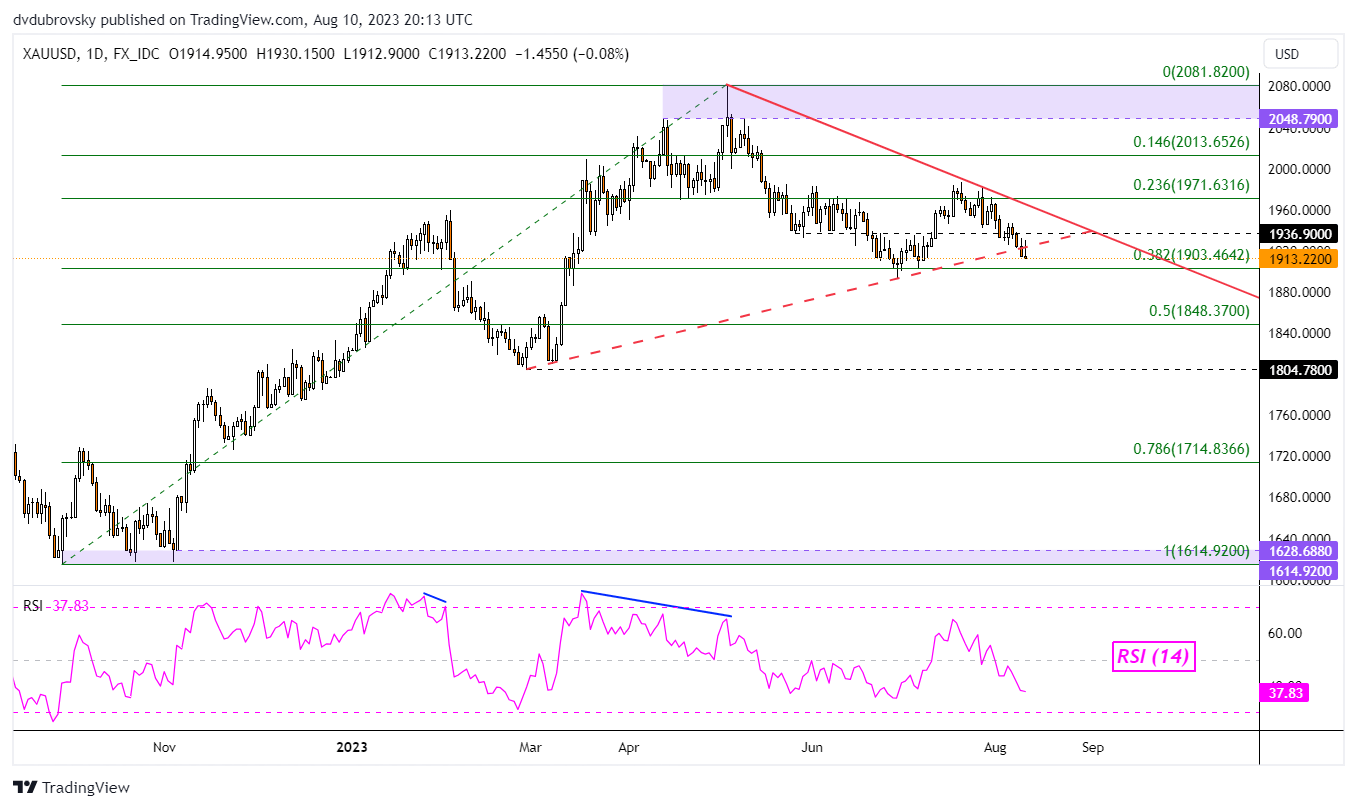
These developments are leaving the yellow metal in a precarious state heading into the final 24 hours of this week. On the daily chart below, gold appears to be confirming a breakout under a rising trendline from February. From here, immediate support is the 38.2% Fibonacci retracement level at 1903. Pushing below this price opens the door to an increasingly bearish technical bias.

XAU/USD Daily Chart
--- Written by Daniel Dubrovsky, Senior Strategist for DailyFX.com