


Gold Price (XAU/USD) Analysis, Price, and Chart
- US PCE print may spark a bout of short-term volatility in the precious metal.
- Technical support is coming under pressure.

For all market-moving data releases and events, see the DailyFX Economic Calendar
The recent leg higher in US Treasury yields continues to press down on gold and with rates expected to stay high, or even higher, for longer then the path of least resistance for the precious metal looks lower.
Thursday’s robust final Q1 US GDP reading – 2% actual vs 1.4% forecast and 2.6% prior – sent US Treasury yields spinning higher. Markets took yesterday’s number as a sign that the US economy is doing better than previously thought, allowing the Fed room to hike rates further in its fight against inflation. The latest market expectations point to rates staying higher for longer with the first rate cut pushed out to the middle of Q1 next year. This is in stark contrast to expectations seen 2-3 months ago when interest rate cuts were predicted for late Q3/early Q4 this year.
The market is now waiting for the latest look at US inflation with the Fed’s preferred measure of price pressures, Core PCE, released later today. Any deviation from market expectations of 4.7% for the core reading will spark volatility in the precious metal, especially with most of the US expected out next Monday and Tuesday (Independence Day). This potential lack of liquidity will add to volatility later today.
The daily gold chart shows the precious metal trading on either side of $1,904/oz. the 61.8% retracement level of the September 28 ($1,615) to May 4 ($2,081) move. Below here lies the 200-day simple moving average at $1,860/oz. and the 50% Fibonacci retracement at $1,848/ox. A move higher would find initial resistance at $1,932/oz.
Gold Daily Price Chart – June 30, 2023
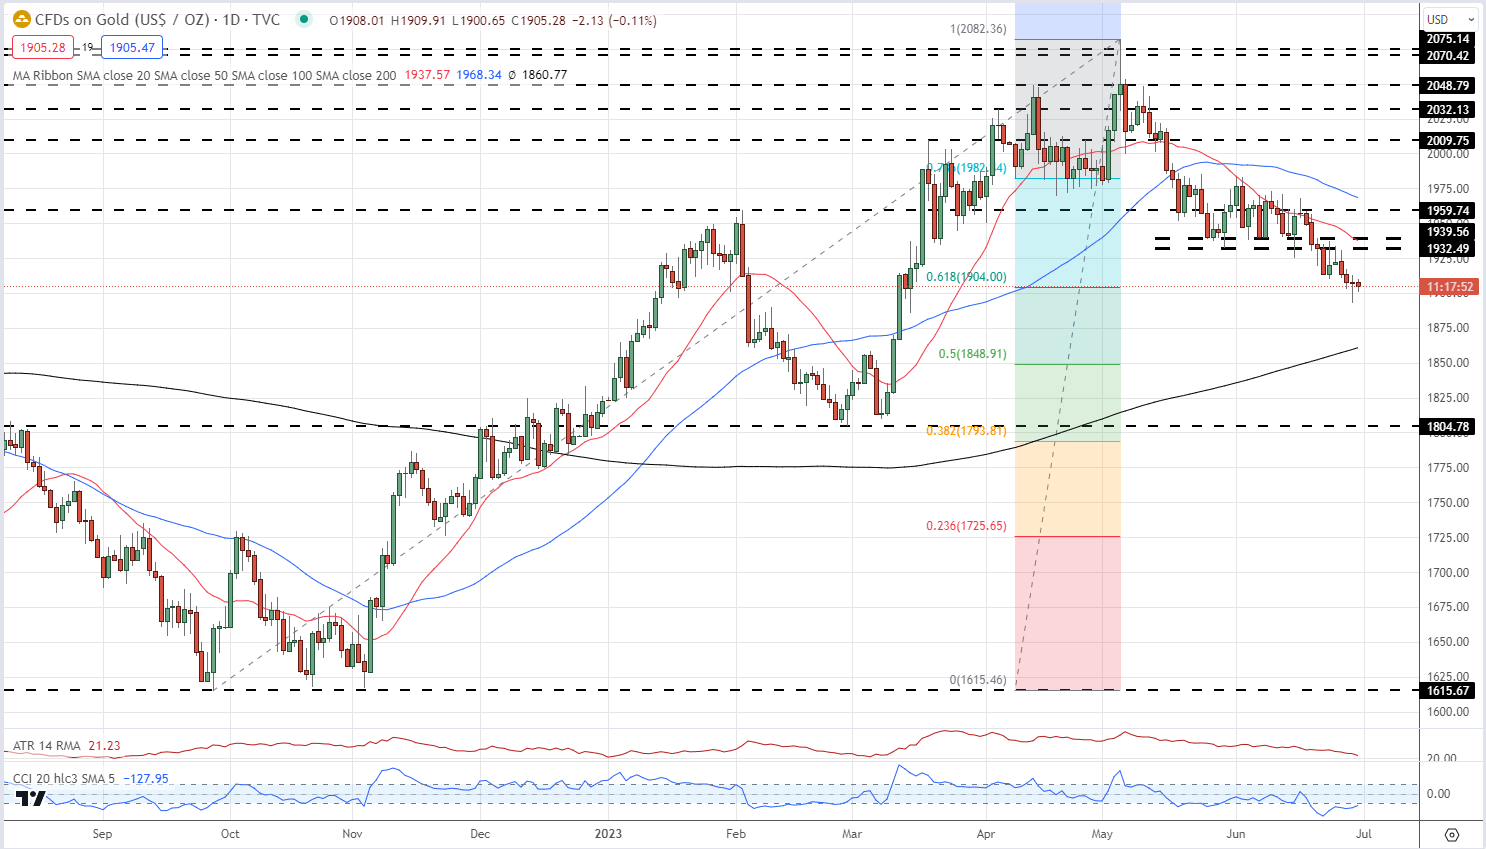
Chart via TradingView
| Change in | Longs | Shorts | OI |
| Daily | -8% | 9% | -1% |
| Weekly | -2% | 6% | 1% |
Retail Positioning is Little Changed on the Week
Retail trader data show 73.17% of traders are net-long with the ratio of traders long to short at 2.73 to 1.The number of traders net-long is 4.30% lower than yesterday and 2.28% lower than last week, while the number of traders net-short is 3.67% higher than yesterday and 4.74% higher than last week.
We typically take a contrarian view to crowd sentiment, and the fact traders are net-long suggests Gold prices may continue to fall. Yet traders are less net-long than yesterday and compared with last week. Recent changes in sentiment warn that the current Gold price trend may soon reverse higher despite the fact traders remain net-long.
What is your view on Gold – bullish or bearish?? You can let us know via the form at the end of this piece or you can contact the author via Twitter @nickcawley1.


