


Gold, XAU/USD, Treasury Yields, US Dollar, Economic Data, PCE, COT Data – Talking Points
- Gold prices are finding refuge during Asia-Pacific trading after steep losses
- Traders have US economic data in focus, including PCE and durable goods
- COT data revealed that speculators are growing less confident in bullion

Gold prices are staging a modest recovery during Asia-Pacific trading as equity markets search for direction following a selloff on Wall Street. Bullion prices fell more than 1% throughout New York trading as stocks moved lower and the US Dollar moved higher. The Federal Reserve’s hawkish outlook on rate hikes has solidified in recent weeks, and FOMC speakers have made that very clear to markets.
On Monday, Cleveland Fed President Loretta Mester sounded more hawkish than ever, stating the Fed should “act more aggressively.” Ms. Mester went on to say, “Further increases in our policy rate will be needed,” speaking from the Massachusetts Institute of Technology. The 10-year Treasury yield rose to 3.931%, the highest point since April 2010. The US Dollar saw broad strength as well, gaining around 1%. Stronger US yields and a higher Dollar typically hurt gold’s appeal as an investment.
According to the CFTC’s Commitments of Traders (COT) report released on Friday, gold speculators scaled back their bullish by 12k contracts for the week ending September 20. That is the smallest position among non-commercial longs since June 2019. Shorts increased by 21.7k contracts, reducing the net long position to 60.7k. The movement shows that traders have grown less bullish on the metal. However, the elevated short position also opens gold up to a possible rally if prices bounce and force shorts to cover.
The Personal Consumption Expenditures Price Index (PCE) for August is due later this week on September 30. Analysts expect the core PCE component—which excludes volatile food and energy prices—to rise 4.7% on a year-over-year basis in August. That would be up from 4.6% in July, not exactly an encouraging sign for the Federal Reserve. A hotter-than-expected print would likely cripple gold prices further. Fed funds futures are currently pricing a 78.3% chance for a 75-basis point hike at the November 02 FOMC. Until then, US consumer confidence for September and durable goods orders for August may help to shed more light on the economy, which may impact FOMC rate hike bets and government bond yields.
Gold (XAU/USD) and COT Gold Long/Short Speculators - Weekly Chart
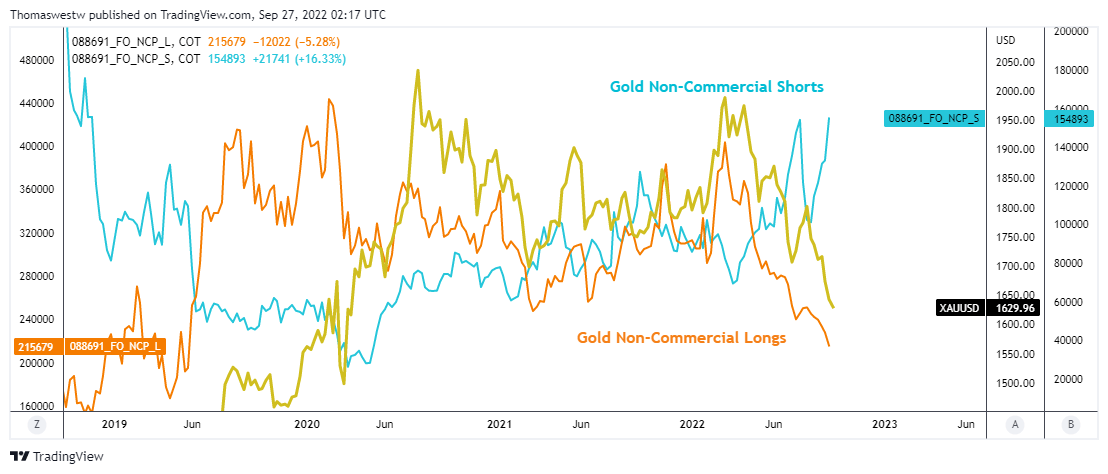
Chart created with TradingView

--- Written by Thomas Westwater, Analyst for DailyFX.com
To contact Thomas, use the comments section below or @FxWestwater on Twitter


