


DAX Futures Fall- OPEC Cuts Oil Production Threatening the Upward Move
Dax futures have suffered a mild setback as the broader equity rally came to a halt. After falling to its lowest level since 2020, the performance-based German Index has continued to test key psychological levels which continue to provide both support and resistance for the near-term move.

Following an approximate 27.3% decline from the January high, a steady decline drove prices lower before falling to a near two-year low currently holding as support at 11,829.
However, with weaker ISM data and a dovish RBA (Reserve Bank of Australia) fueling a rebound in stocks, Dax 40 was able to rise back above prior support turned resistance holding at the key psychological level of 12,000.
Visit theDailyFX Educational Centerto discover theimpact of politicson global markets
DAX 40 Technical Analysis
As shown on the weekly chart below, price action currently remains in a downward trajectory that has continued to hold since the beginning of the year. With a consistent decline driving prices back towards two-year lows, key technical levels from historical moves have recently come back into play.
After falling to September 2019 levels at the start of the week, failure to hold below 11,800 allowed bulls to drive prices higher before running into a wall of resistance at 12,700.
DAX 40 Weekly Chart
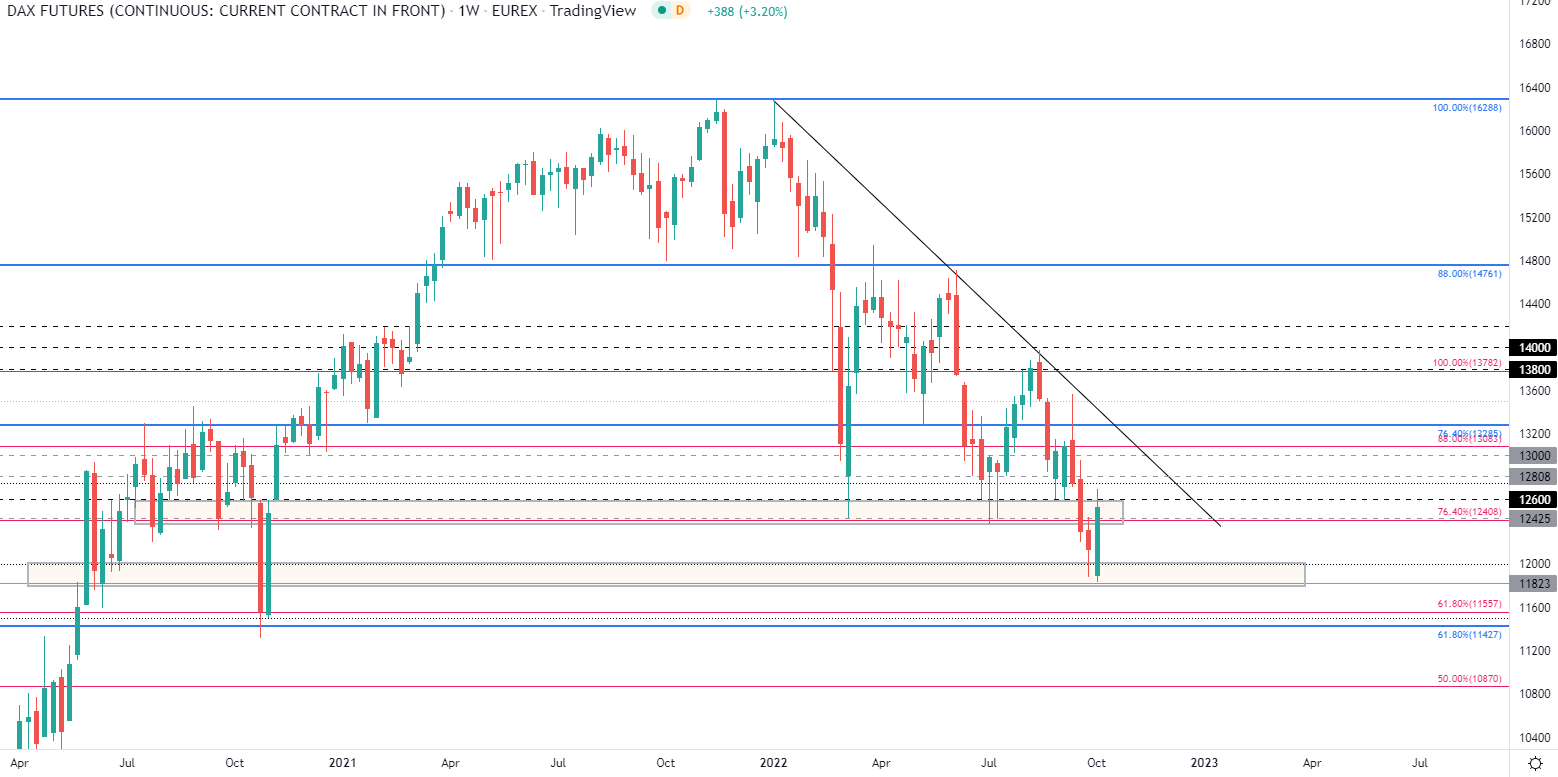
Chart prepared byTammy Da Costausing TradingView
However, a rejection of this level forced prices lower before finding stability at 12,600. With Fibonacci levels from both the 2022 and the 2020 move holding both bulls and bears at bay, a few levels remain key.
With Dax currently trading above 12,500, a break below this level and below 12,000 could provide a retest of the recent low of 11,829 and towards the 61.8% retracement of the 2020 move at 11,584.
DAX (Germany 40) Daily Chart
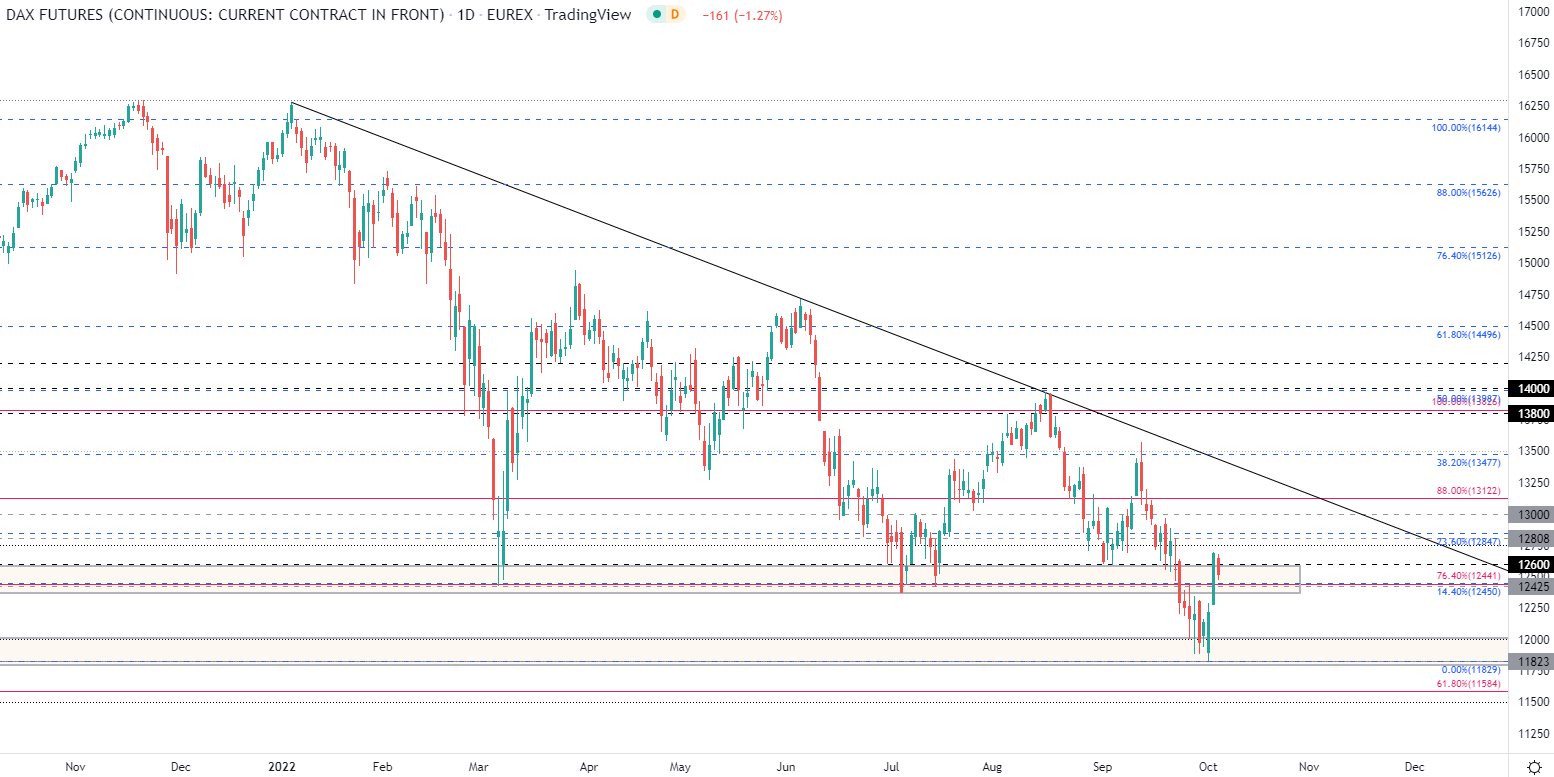
Chart prepared byTammy Da Costausing TradingView
For the bullish move, a break above 12,600 and above trendline resistance at around 12,847 could fuel further gains with the next level of resistance holding at 13,000.
| Change in | Longs | Shorts | OI |
| Daily | -9% | 7% | 2% |
| Weekly | -27% | 9% | -5% |
--- Written by Tammy Da Costa, Analyst for DailyFX.com
Contact and follow Tammy on Twitter: @Tams707


