British Pound (GBP/USD) Analysis
- Cable rises on the Fed’s increased probability of a “skip” at the June FOMC
- Major risk events this week: NFP, US debt ceiling fears dissipate
- GBP/USD technical levels to consider for a bullish continuation
- The analysis in this article makes use of chart patterns and key support and resistance levels. For more information visit our comprehensive education library

Cable Rises on the Fed’s Increased Probability of a “Skip” at the June FOMC
The dollar’s rise observed throughout most of May has changed course amid increasing support for a ‘skip’ at this month’s FOMC decision. Fed Governor Philip Jefferson and Philadelphia Fed President Patrick Harker sent a message to the market yesterday as both members expressed a preference to skip a potential interest rate hike this month. The option to skip a hike provides the rate setting committee with greater flexibility to hike further down the line or essentially pause hikes depending on the incoming data.
Market implied probabilities of a rate hike this month sat at 71% ahead of the comments yesterday and this morning has reversed, now down at just 42.4%. Such a massive shift in sentiment leaves the dollar vulnerable and opens the door for GBP/USD to claw back recent losses.
Major Risk Events to end off the Week
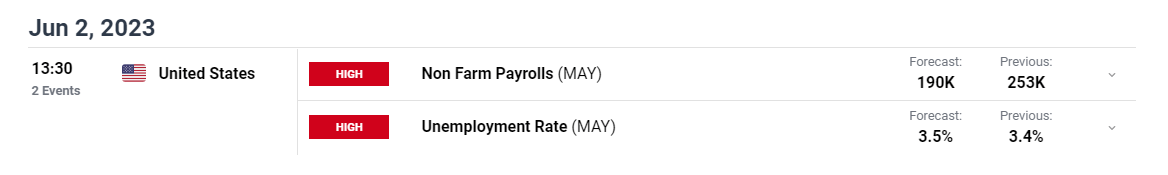
There was a notable lack of high impact UK economic data this week with the US very much the focus towards the end of the week. After last night’s crucial house vote to suspend the US debt ceiling, attention now turns to the Senate but political commentators suggest that a deal is largely expected to become law from here on out. Away from the political arena, US non-farm payroll data is due on Friday as consensus estimates foresee a lower number of jobs were added in May with a slight uptick in unemployment. The Fed will also keep a keen eye on average hourly earnings as far as it influences general price pressures.
Customize and filter live economic data via our DailyFX economic calendar
GBP/USD Technical Analysis and Levels of Interest
Cable has moved above both the 50 SMA and the prior zone of resistance at 1.2445 as the dollar eases. GBP/USD bulls will naturally be eying the swing high of 1.2676 and general zone of resistance around 1.2700. A more immediate benchmark of bullish momentum comes into play at 1.2585.
The RSI trades a little above the middle ground, suggesting that there is more room for upside continuation before the pair enters overbought territory. On the bearish side, if the pair is to move lower from here, 1.2345 and the recent swing low at 1.2308 emerge as most relevant levels of support.
GBP/USD Daily Chart
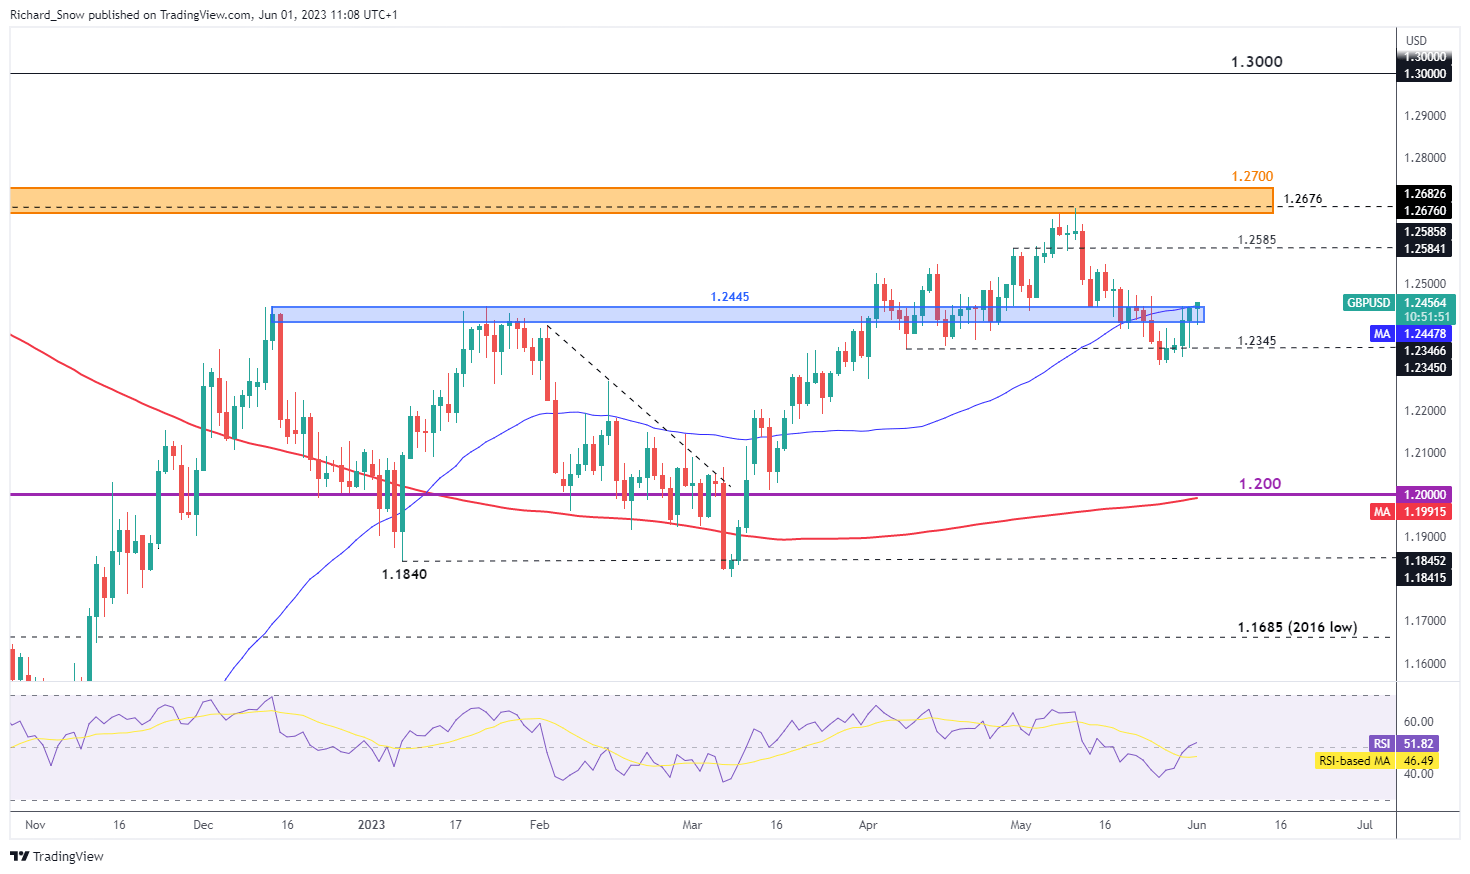
Source: TradingView, prepared by Richard Snow
The weekly chart helps to put shorter-term moves into perspective. Cable remains within the broader longer-term uptrend which adds to the bullish outlook.
GBP/USD Weekly Chart
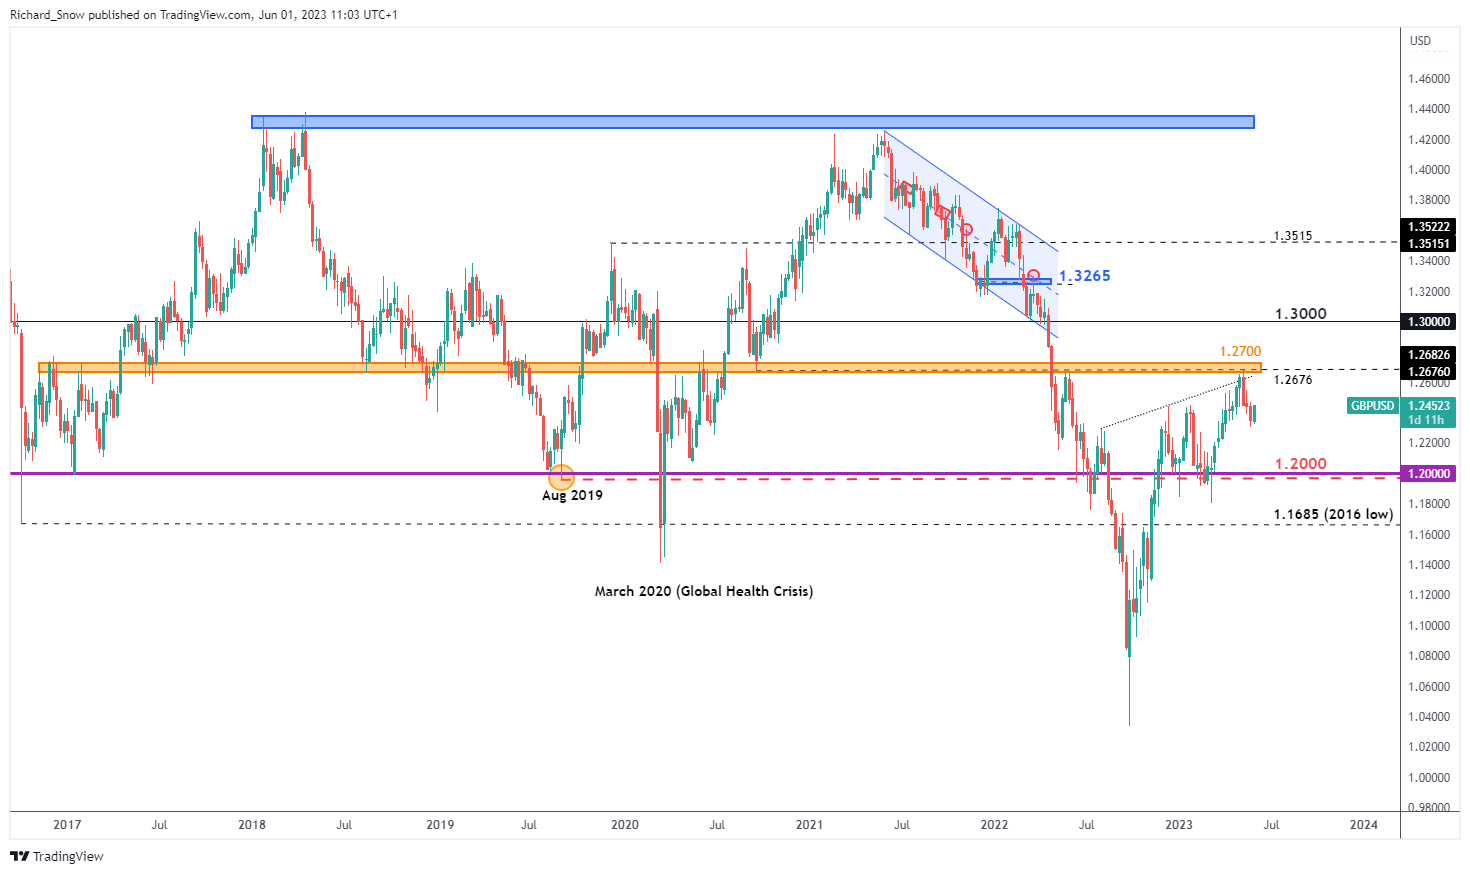
Source: TradingView, prepared by Richard Snow
Institutional and Retail Positioning Snapshot
Common Trend Observed but Divergence Appears in Near-Term Direction
Large hedge funds and speculators reveal a rather mixed view on sterling according to data up until 23 May, reported on 26 May. Long positioning (orange line) sits ever so slightly above short positioning (blue line), as cable appears to be making another move to the upside.
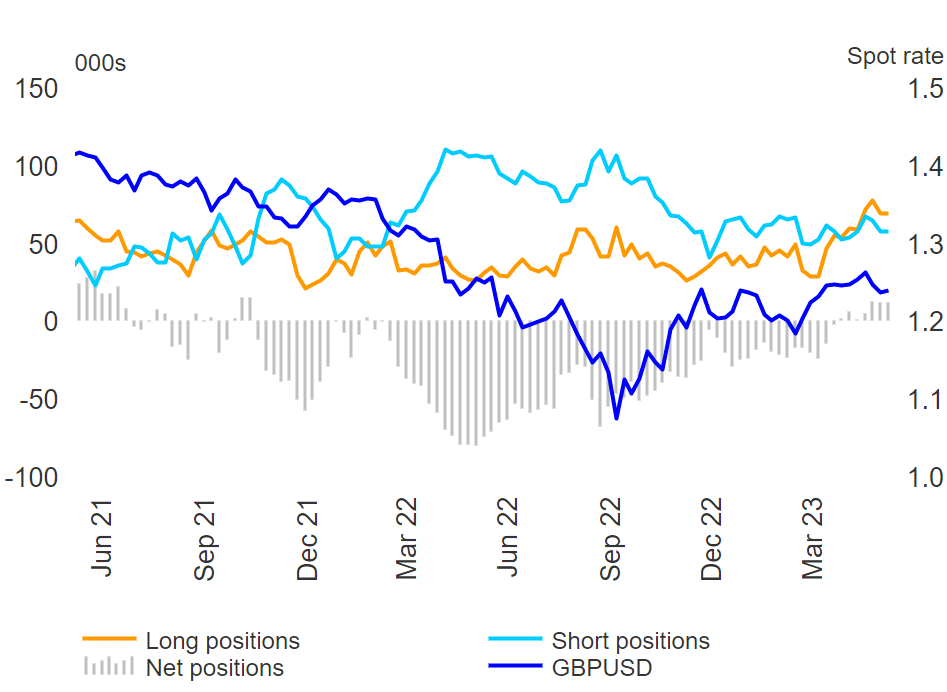
Source: Refinitiv, prepared by Richard Snow
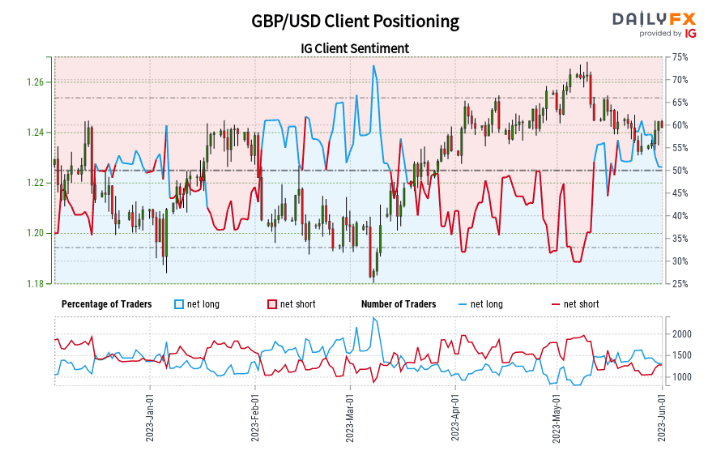
On the other hand, IG client sentiment, which also shows a slight net-long positioning, reveals a reduction in recent longs and an uptick in recent shorts. Being the contrarian indicator that it is, a pick up in shorts with a reduction of longs hints at a potential bullish advance despite overall positioning ever so slightly on the long side.
| Change in | Longs | Shorts | OI |
| Daily | 0% | 18% | 8% |
| Weekly | -32% | 47% | -8% |
Source: DailyFX, IG, prepared by Richard Snow
GBP/USD:Retail trader data shows 50.34% of traders are net-long with the ratio of traders long to short at 1.01 to 1.
We typically take a contrarian view to crowd sentiment, and the fact traders are net-long suggests GBP/USD prices may continue to fall.
The number of traders net-long is 6.31% lower than yesterday and 17.37% lower from last week, while the number of traders net-short is 11.69% higher than yesterday and 18.40% higher from last week.
Yet traders are less net-long than yesterday and compared with last week. Recent changes in sentiment warn that the current GBP/USD price trend may soon reverse higher despite the fact traders remain net-long.
Trade Smarter - Sign up for the DailyFX Newsletter
Receive timely and compelling market commentary from the DailyFX team
--- Written by Richard Snow for DailyFX.com
Contact and follow Richard on Twitter: @RichardSnowFX