


GBP/USD Talking Points
- GBP/USD slides from major resistance as bullish momentum subsides.
- Pound Dollar faces technical headwinds in anticipation of next week’s event risk.
- FOMC and BoE (Bank of England) brace for further rate hikes with any surprises adding as a potential catalyst for price action.

GBP/USD Technical Analysis
The British Pound is starting to show signs of weakness against its Dollar counterpart as upside momentum subsides. With bulls driving GBP/USD into a wall of resistance around 1.230, the midpoint of the 2021 – 2022 remains key for the imminent move.
After reaching a high of 1.2345 earlier this week, failure to hold above this level allowed bears to step in, driving prices lower. As price action falls into a narrow range of technical significance, the 200-day MA (moving average) is providing support at 1.212.
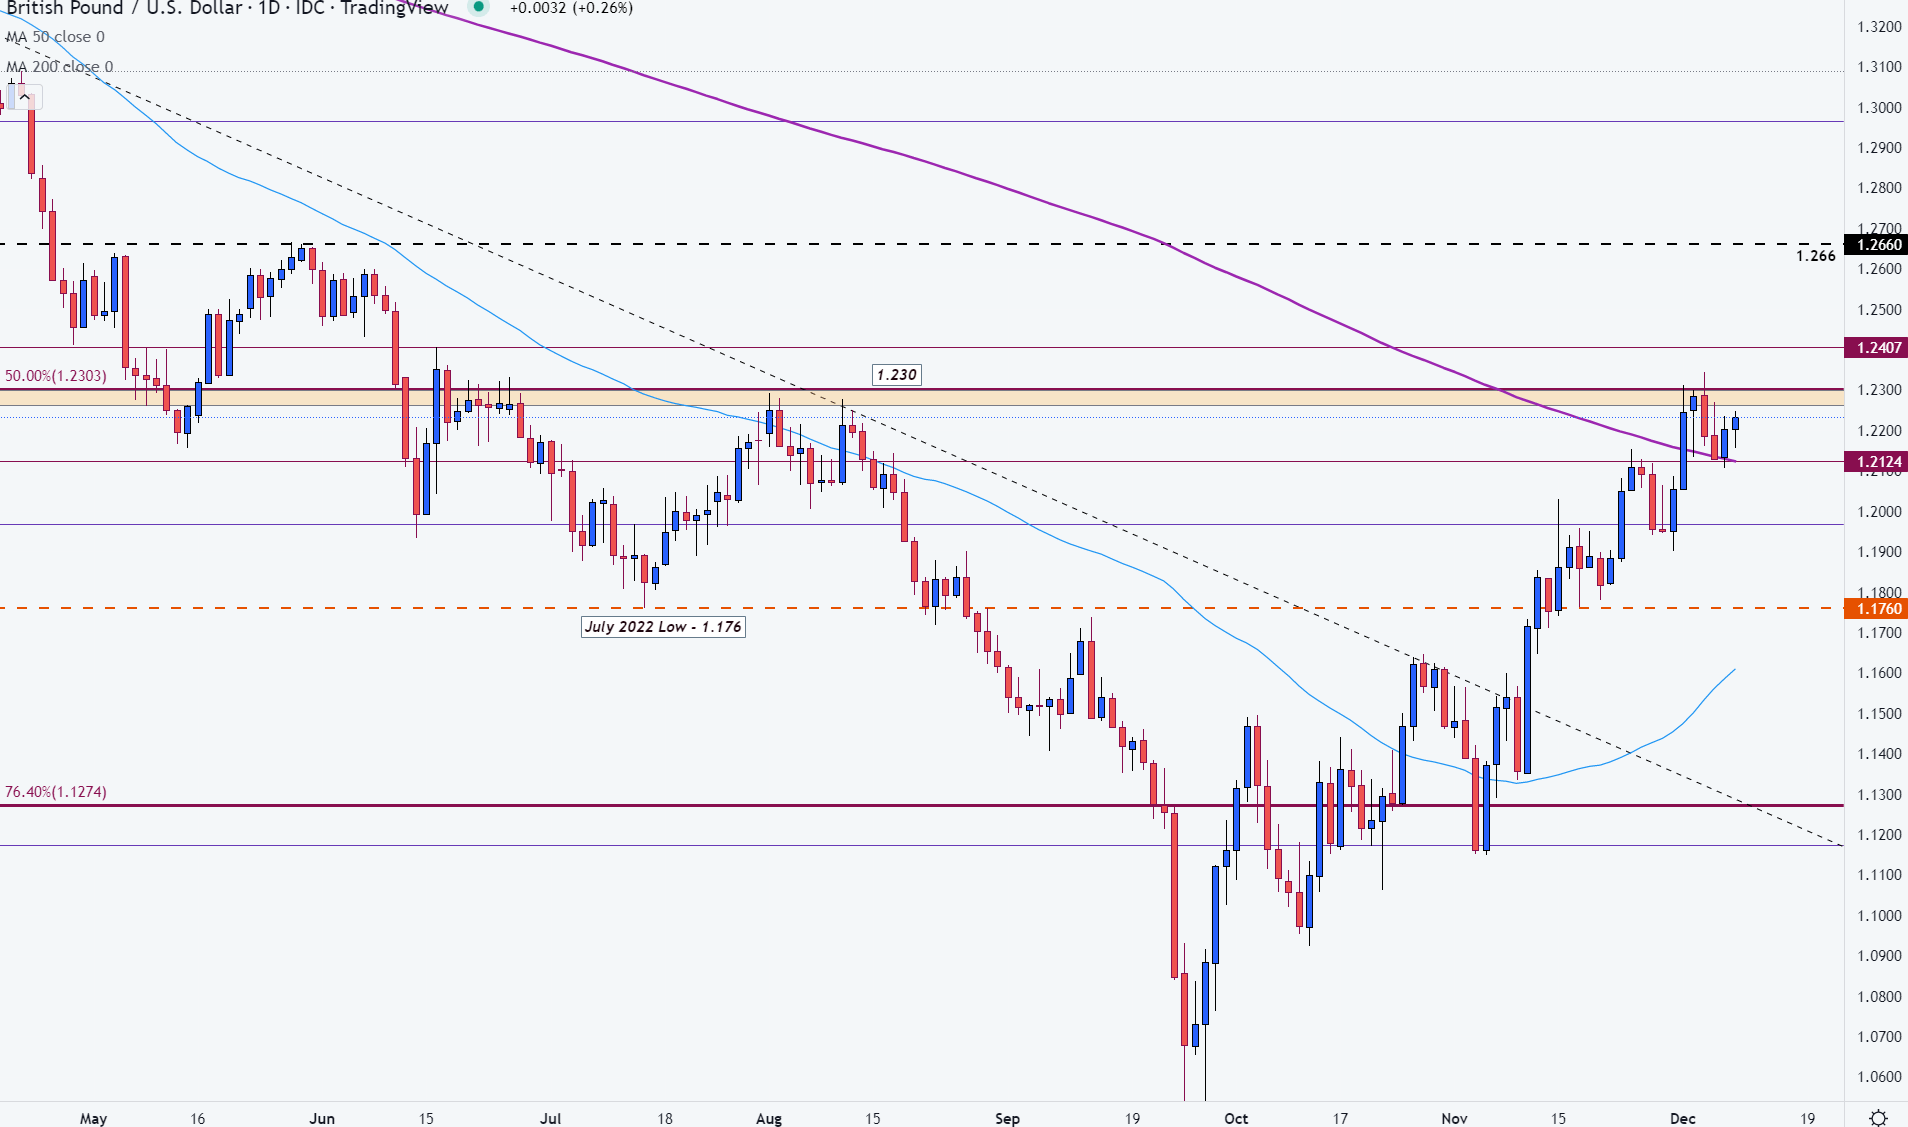
Chart prepared by Tammy Da Costa using TradingView
With the major currency pair currently trading around the key psychological level of 1.220, a break of current support or resistance could drive the short-term move.
While the weekly chart illustrates how the 1.23 handle has provided support and resistance for historical moves, the 50-week MA (moving average) rests just above, around 1.240.

GBP/USD Weekly Chart
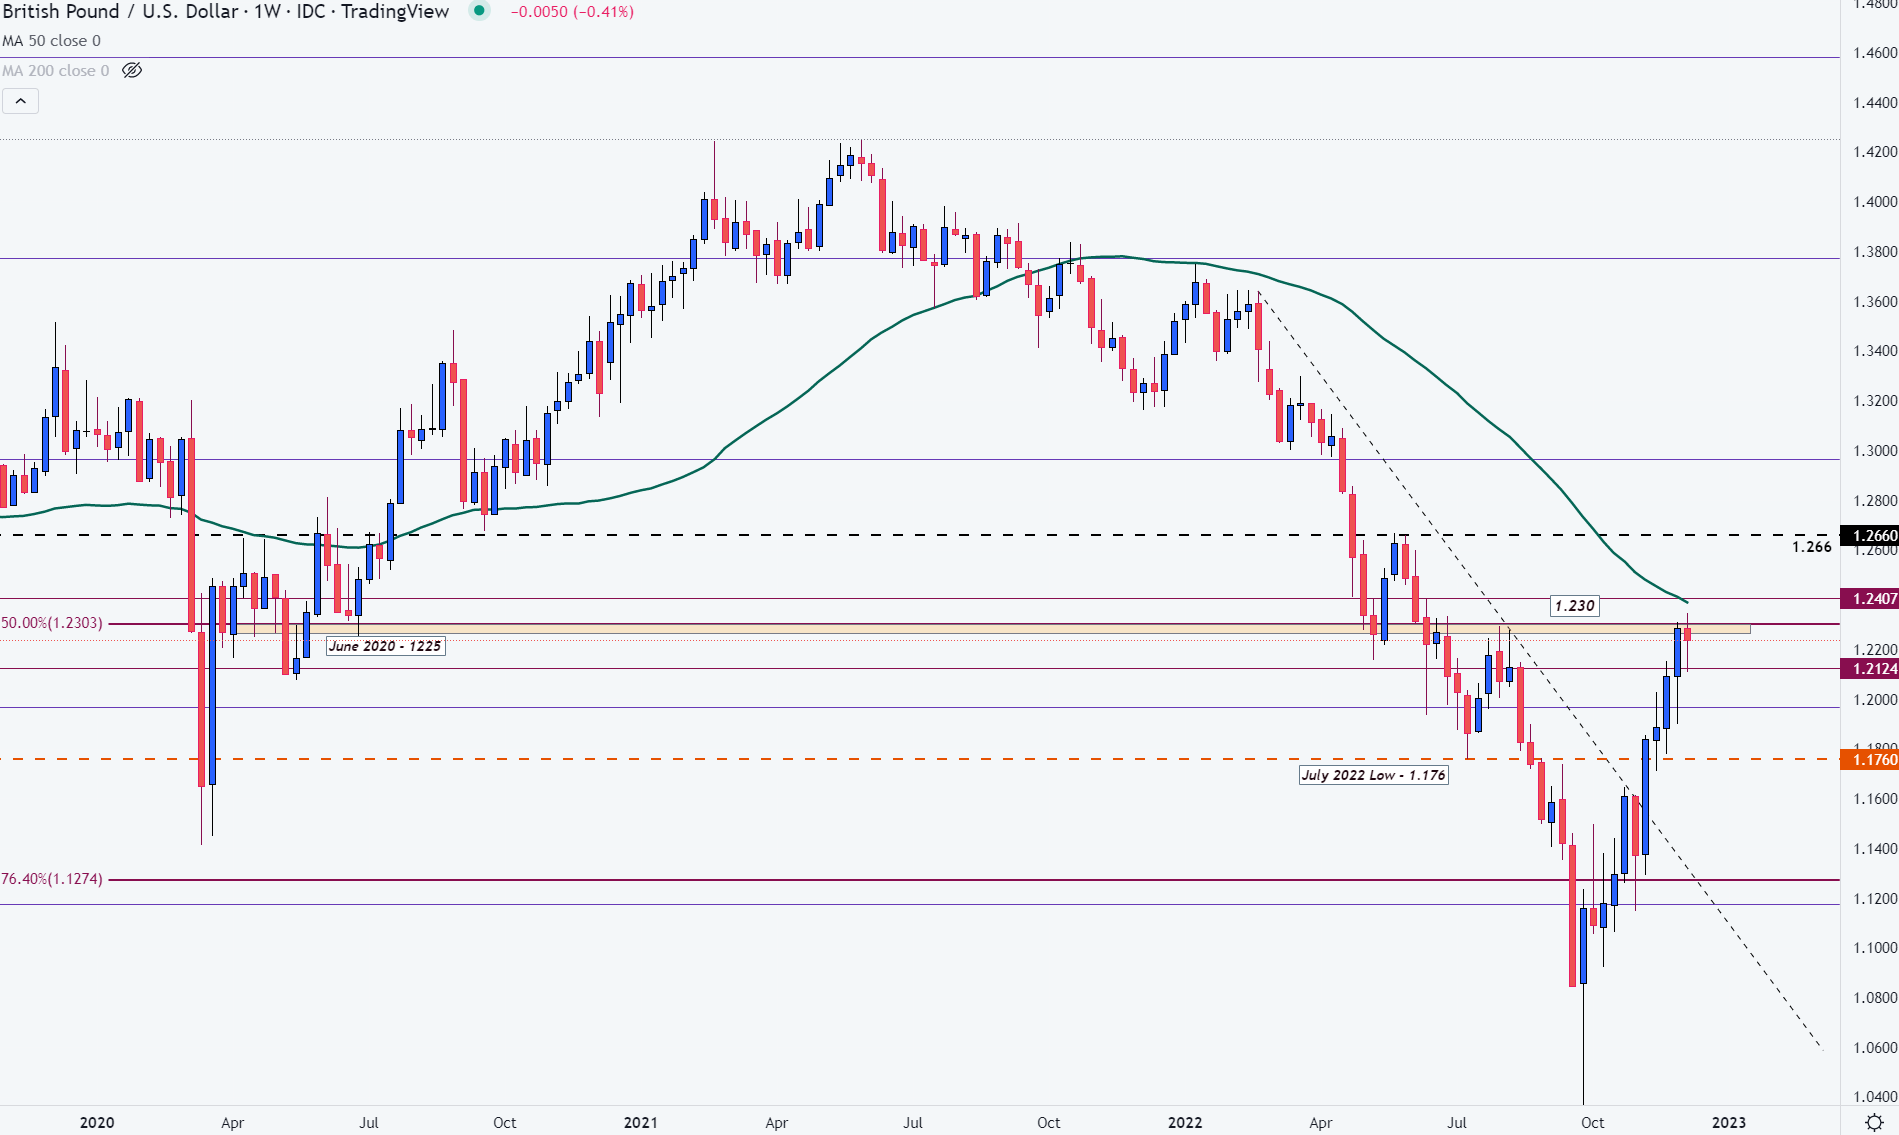
Chart prepared by Tammy Da Costa using TradingView
For bulls to continue to drive a broader recovery, a break of 1.23 and 1.24 could see prices rising back to the next key psychological level of 1.250.
However, if prices fall below 1.220, additional selling pressure and a move below 1.212 could fuel downside momentum back towards 1.176.
GBP/USD Client Sentiment
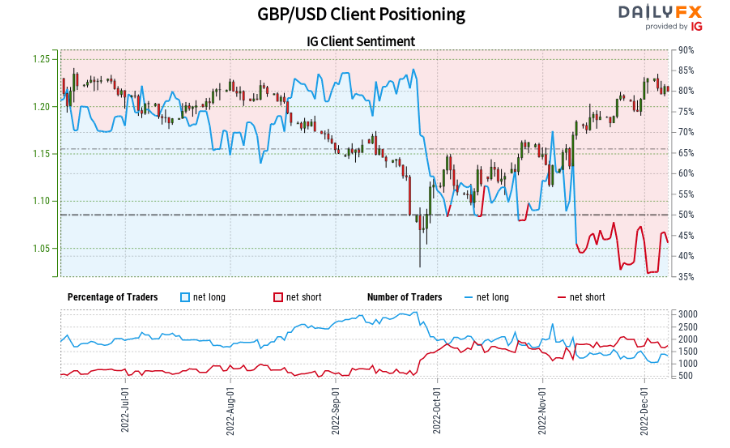
IG client sentiment provides real-time data on retail trader positioning which could highlight potential extremes in crowd behavior. At the time of writing, retail trader data shows 44.57% of traders are net-long with the ratio of traders short to long at 1.24 to 1.
We typically take a contrarian view to crowd sentiment, but the fact traders are less net-short from last week suggests GBP/USD gives us a further mixed trading bias.
| Change in | Longs | Shorts | OI |
| Daily | 3% | -7% | -3% |
| Weekly | 4% | -10% | -5% |
--- Written by Tammy Da Costa, Analyst for DailyFX.com
Contact and follow Tammy on Twitter: @Tams707


