


FTSE 100 Talking Points:
- FTSE 100 edges higher but psychological and technical levels aren’t making things easier for bulls.
- GBP/USD remains under threat as surging US Yields and a weak Pound drive the pair lower.
- Earnings season continues into next week as UK heavyweights provide an additional catalyst for stocks.

FTSE 100 Technical Analysis
Over the past week, anotherdouble-digit inflation printand the resignation of UK Prime Minister Liz Truss placed additional pressure on GDP/USD but did little to deter the FTSE.
Despite waning sentiment and increased uncertainty in the United Kingdom that has weighed heavily on the British Pound, the FTSE 100 has managed to end the week in the green.
As price action continues to threaten the 200-week MA (moving average) at around 6948, a hold above the 7000 psychological level is required before the recovery can proceed.
With the October high currently holding at 7088.17, failure to gain traction above 7000 could place additional pressure on the short-term move.
UK FTSE 100 Daily Chart
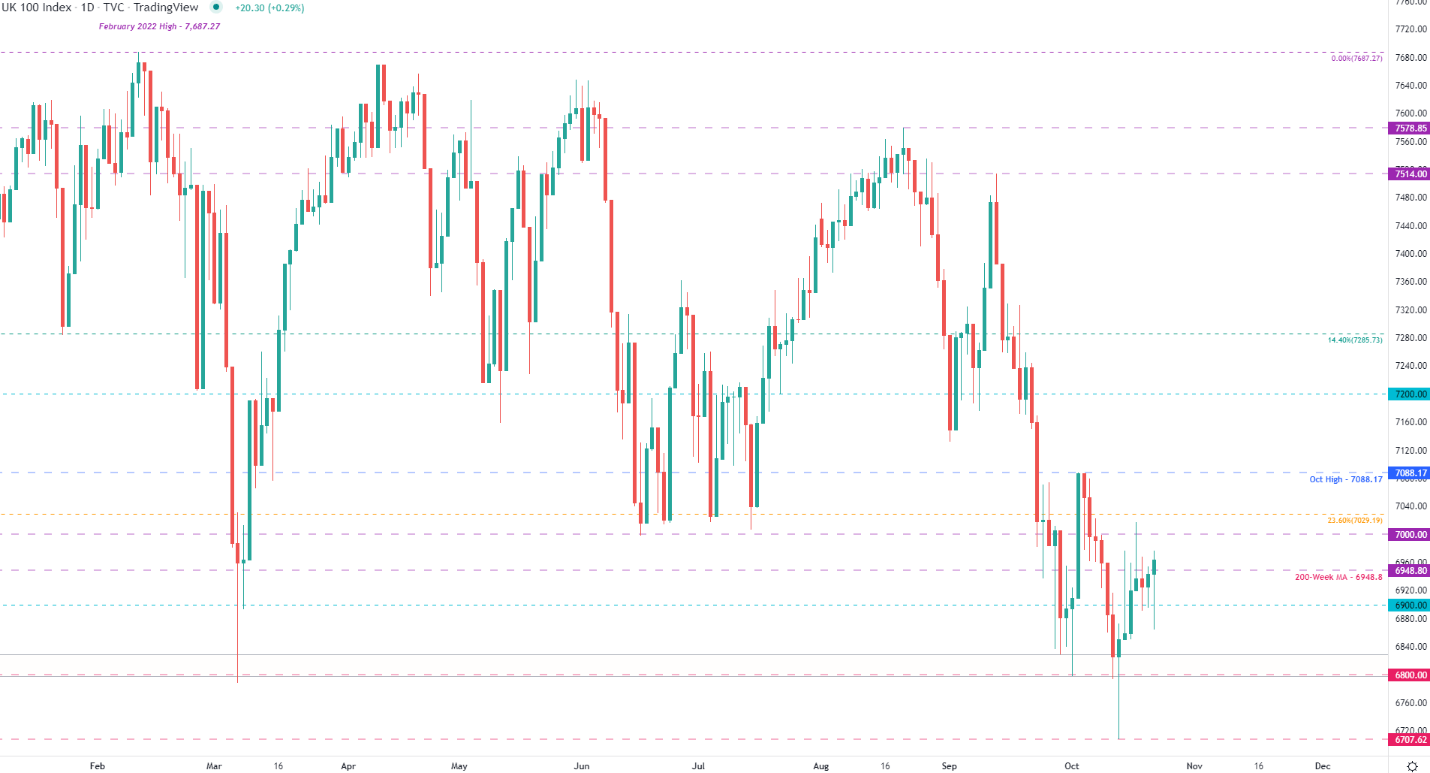
Chart prepared by Tammy Da Costa using TradingView
Taking a closer look at the four-hour chart and a few key zones remain on the cards. If the above-mentioned resistance levels fail to hold, a rejection of 7000 and a break below the 6800 – 6830 range could fuel another bearish move.
UK FTSE 100 Four-hour Chart
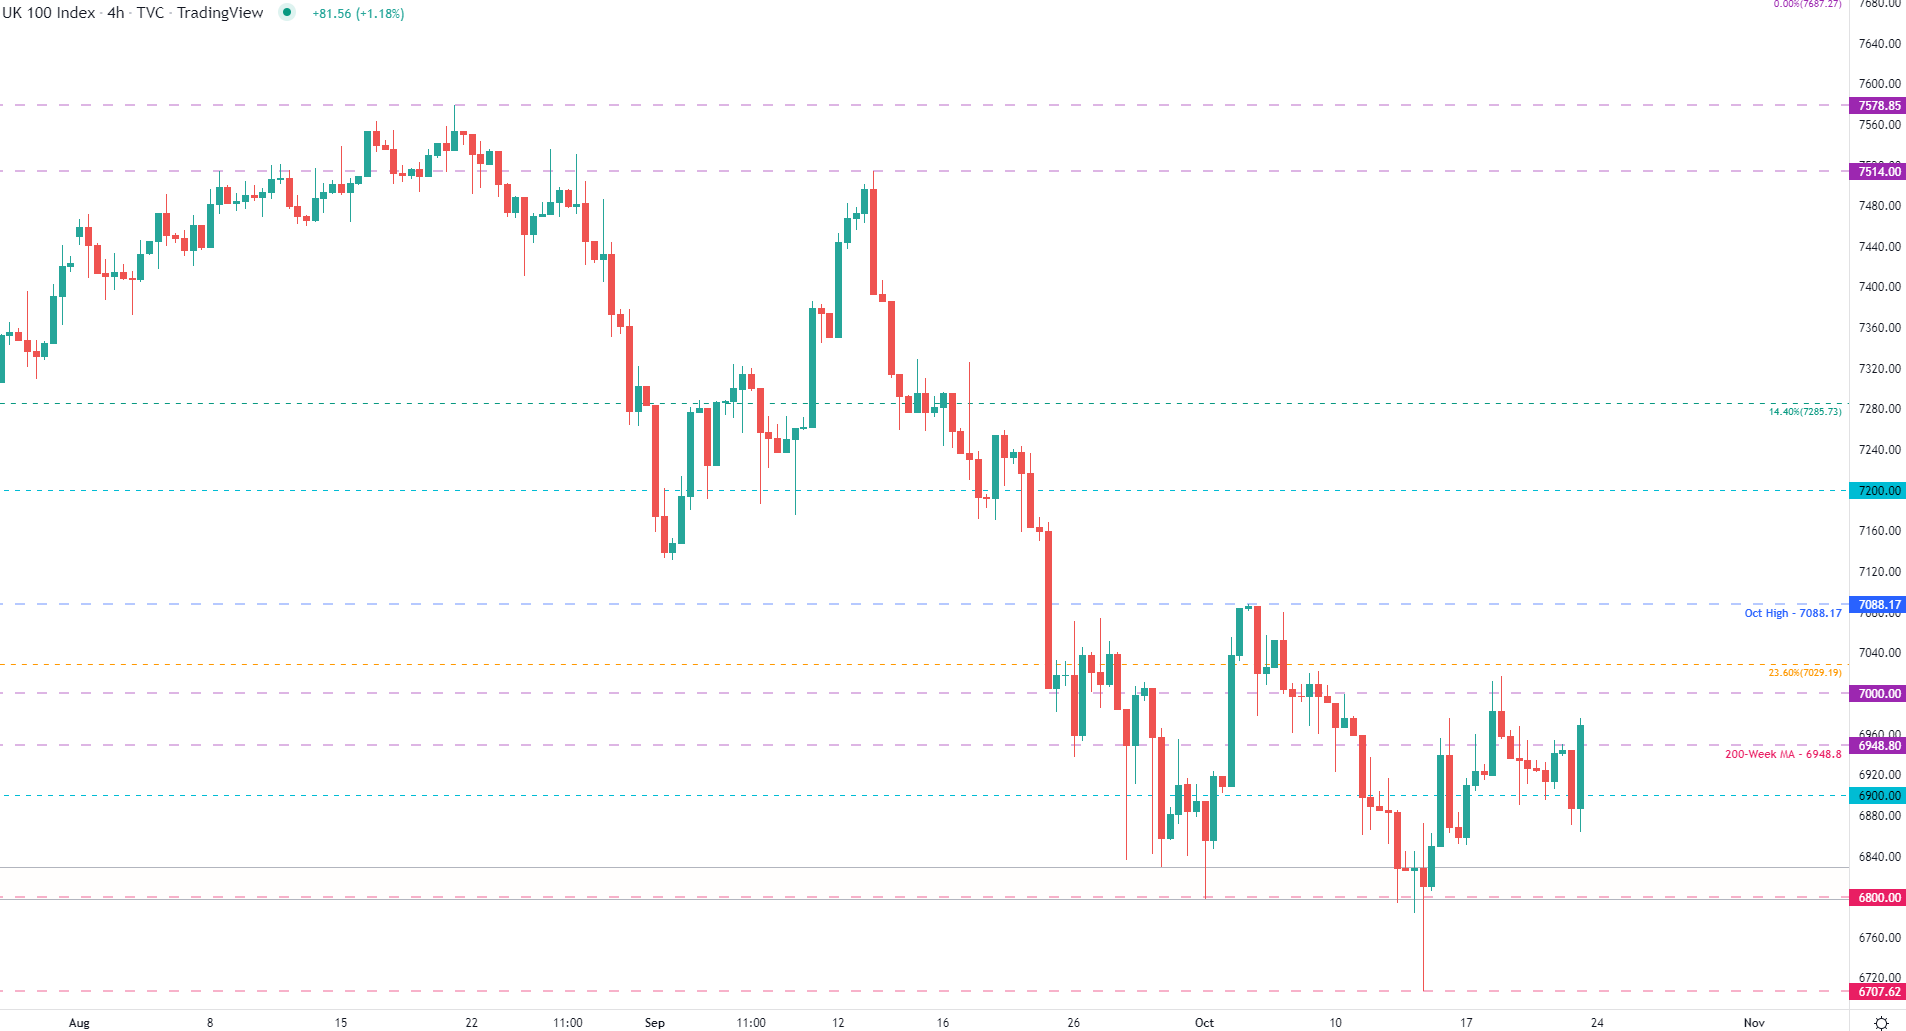
Chart prepared by Tammy Da Costa using TradingView

As UK firms release their Q3 earnings, next week’s agenda could assist in providing a fresh catalyst for price action. If the major heavyweights report optimistic Q3 results, it may be possible for the recovery to progress. However, if company earnings come in lower than expected, additional selling pressure may open the door for bearish continuation towards 6622.
Earnings Calendar
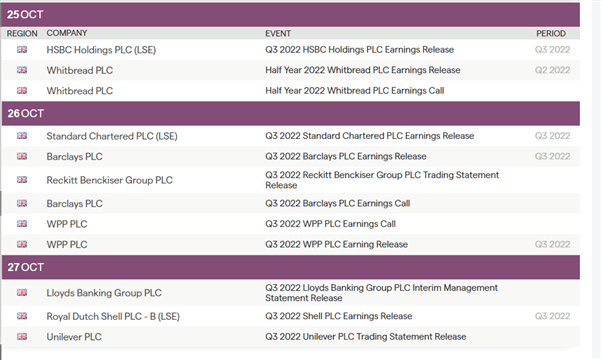
Source: IG
FTSE 100 Key Levels
| Support | Resistance |
|---|---|
| S1: 6900 | R1: 7000 |
| S2: 6830 | R2: 7088 |
| S3: 6622 | R3: 7285 |
--- Written by Tammy Da Costa, Analyst for DailyFX.com
Contact and follow Tammy on Twitter: @Tams707


