


FTSE 100 Talking Points:
- UK double-digit inflation raises concerns of a deeper recession
- FTSE 100 threatens 7,000 as bank stocks take strain
- GBP/USD struggles to hold onto recent gains threatening UK stocks

FTSE 100 Technical Analysis
The UK FTSE 100 has failed to hold above technical resistance after another double-digit inflation print raised fears of a deeper recession.
With both political and macroeconomic turmoil weighing on the British Pound (GBP), the major stock index has fallen back below prior support turned resistance currently holding at the key psychological level of 7,000.
After a sharp decline from the September high of 7,514, a rebound off 6,707 allowed FTSE to climb higher before reaching the 78.6% Fibonacci retracement of the 2009 – 2018 move holding as additional resistance at around 6,952.

With a narrow zone of confluency forming between 6,850 and 7,000, price action continues to hover around the 200-week MA (moving average) at 6,948 highlighting the importance of this zone.
FTSE 100 Weekly Chart
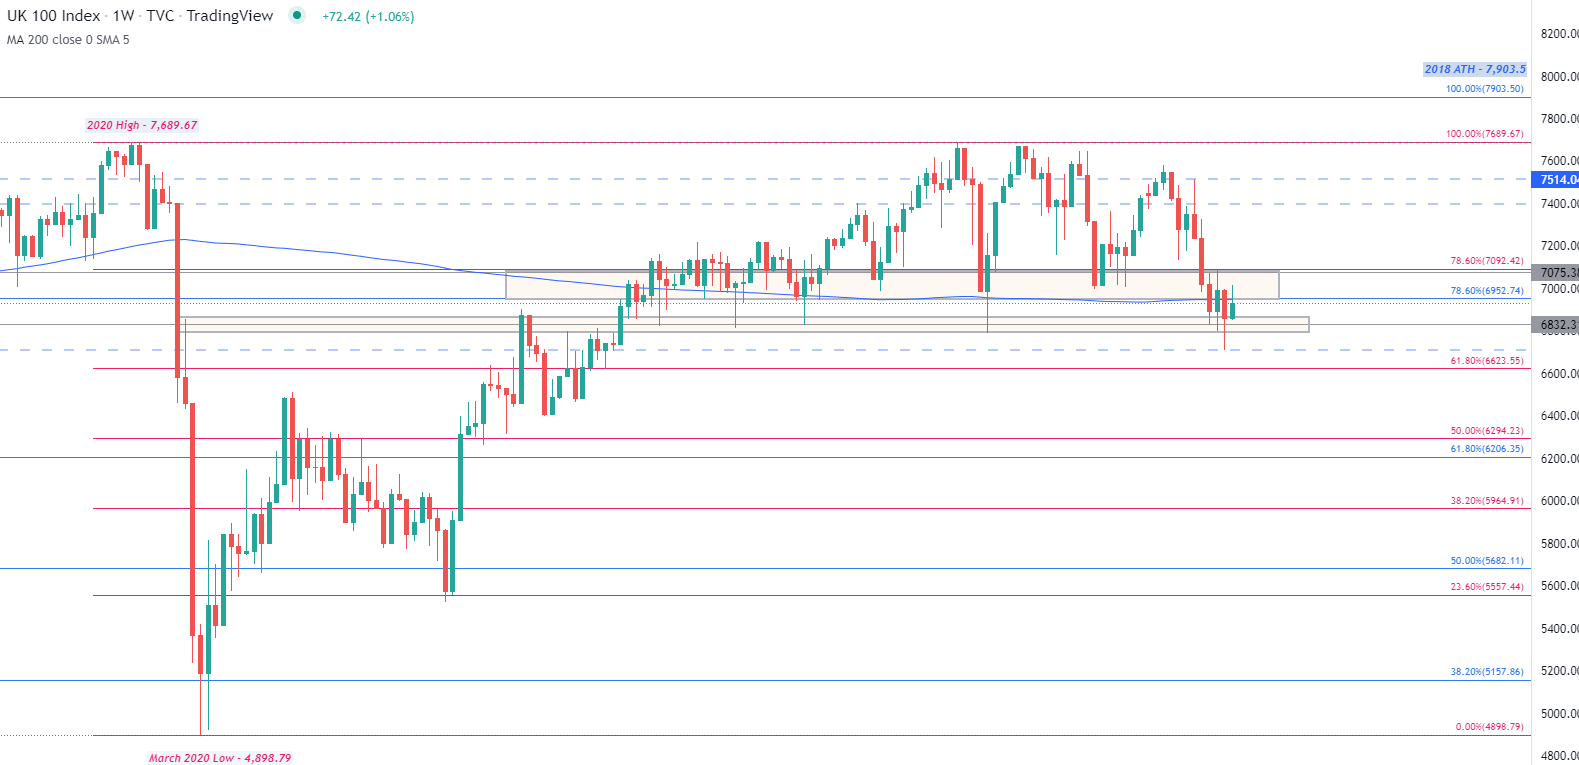
Chart prepared by Tammy Da Costa using TradingView
As prices remain encapsulated between technical support and resistance, the four-day rally has come to a halt. With an influx of sellers and rising recession fears weighing on sentiment, the next big zone of support continues to hold at 6,850 with a break below opening the door for 6,800.
FTSE 100 Daily Chart
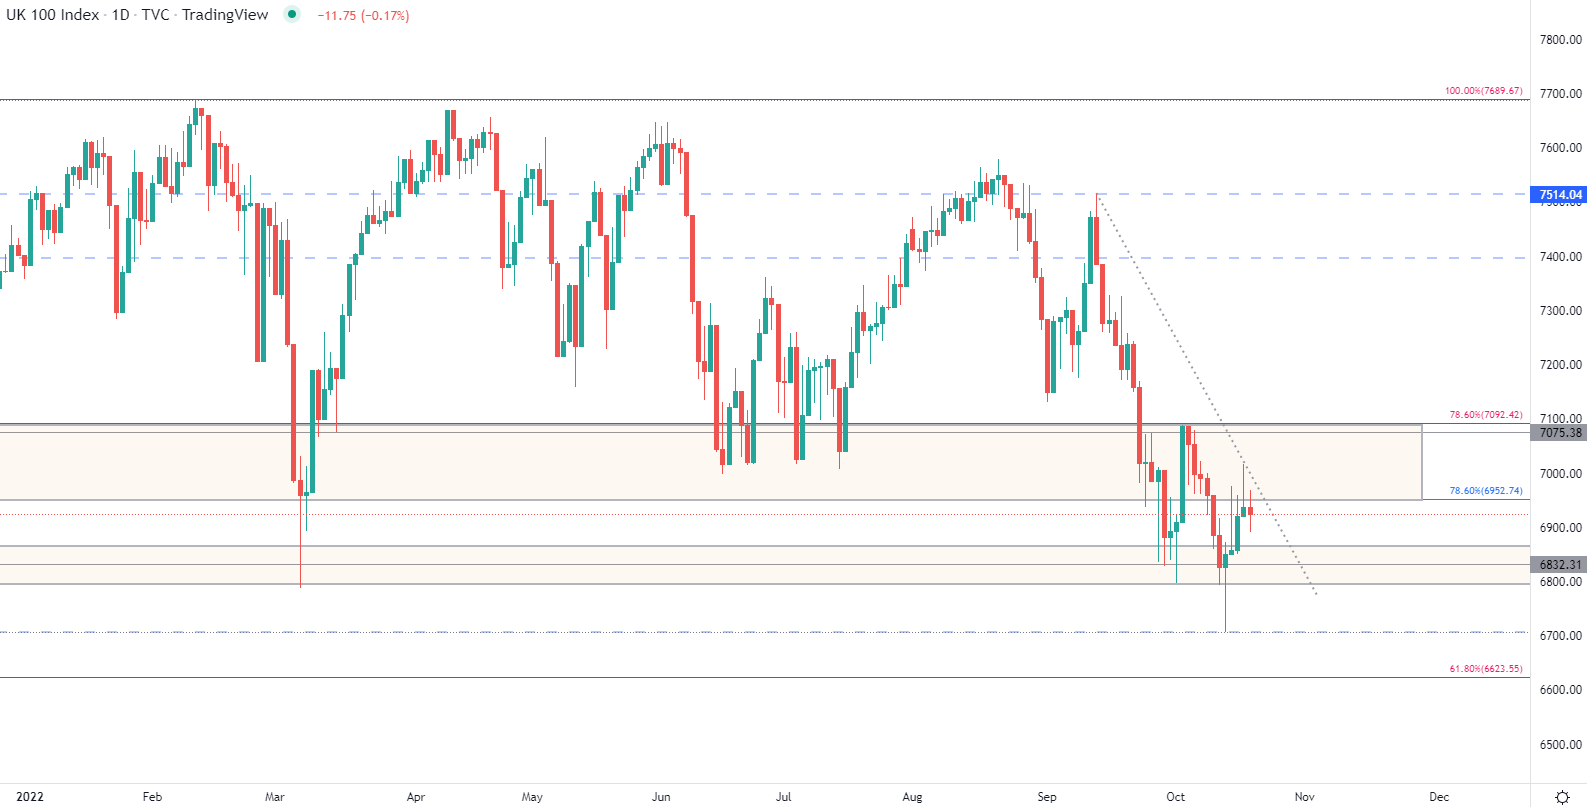
Chart prepared by Tammy Da Costa using TradingView
FTSE 100 Key Levels
| Support | Resistance |
|---|---|
| S1: 6,900 | R1: 6,952 |
| S2: 6,850 | R2: 7,000 |
| S3: 6,707 | R3: 7,092 |
FTSE 100 Client Sentiment
| Change in | Longs | Shorts | OI |
| Daily | -30% | 25% | 2% |
| Weekly | -44% | 44% | 0% |
At the time of writing, retail trader data shows that 67.51% of FTSE 100 traders are net-long with the ratio of traders long to short at 2.08 to 1.The number of traders net-long is 1.46% higher than yesterday and 0.30% lower from last week, while the number of traders net-short is 1.56% lower than yesterday and 7.87% lower from last week.
We typically take a contrarian view to crowd sentiment, and the fact traders are net-long suggests FTSE 100 prices may continue to fall.
Traders are further net-long than yesterday and last week, and the combination of current sentiment and recent changes gives us a stronger FTSE 100-bearish contrarian trading bias.
--- Written by Tammy Da Costa, Analyst for DailyFX.com
Contact and follow Tammy on Twitter: @Tams707


