


FTSE 100 – Technical Forecasts and Analysis
- FTSE 100 nears a zone of strong resistance.
- UK big board is up nearly 14% in the last 3 months.

The FTSE 100 continues its recent outperformance at the start of the new year with the indices looking set to challenge levels last seen around one year ago. The FTSE 100 is 0.60% higher at 7,614 as we approach the US open, helped by strong gains in miners Anglo American (AAL) +3.55%, Antofagasta (ANTO) +3.4%, retail heavyweight Next (NXT) +6.8%, while Ocado (OCDO) and Associated British Foods (ABF) are both 3.5% to the good.
The FTSE 100 has rallied the best part of 14% since the 'Liz Truss’ low in mid-October last year and while it may threaten the May 2018 all-time high at 7,910, the indices will need to break through a strong area of overhead resistance. Looking at the monthly chart, a confirmed break above 7,687 would leave the all-time high in play.
FTSE 100 Monthly Price Chart – January 5, 2023
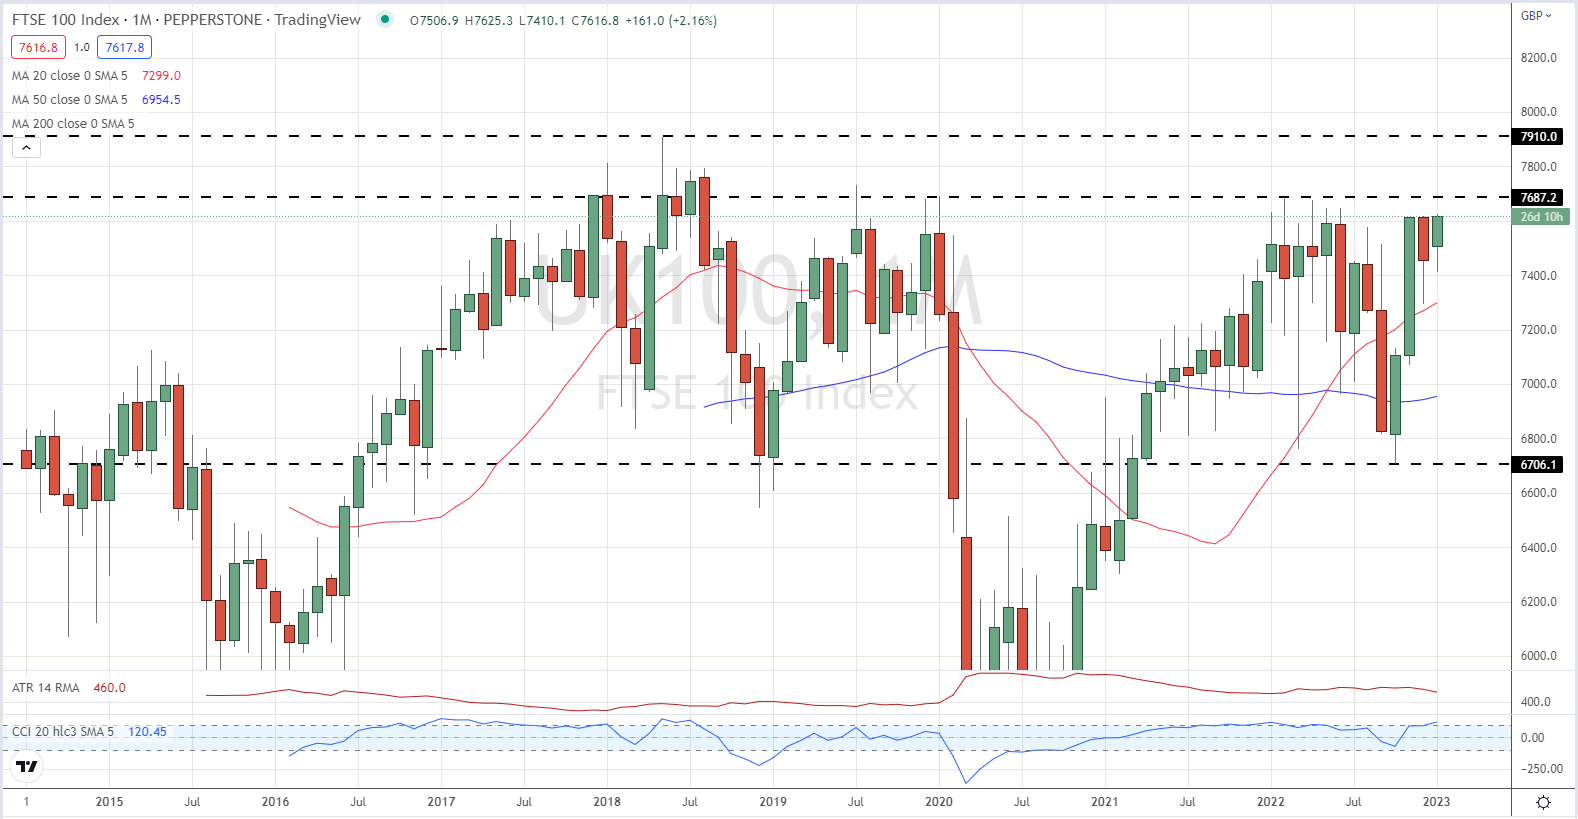

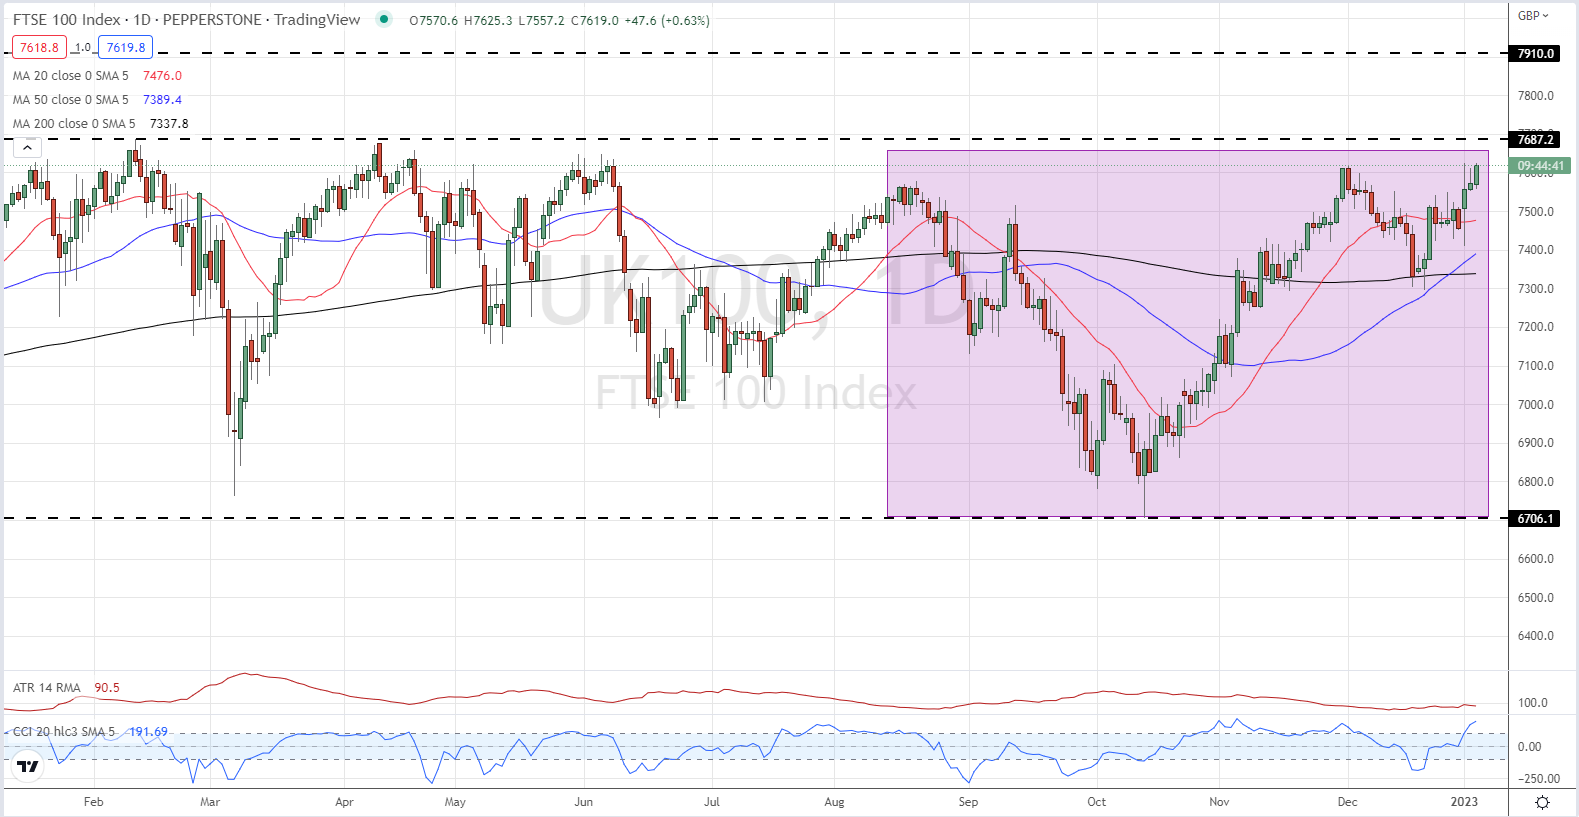
Looking at the daily chart and a bullish ‘cup and handle’ formation is currently being made which suggests that the all-time high is within reach. In addition, a bullish ‘golden cross’ moving average crossover printed at the end of last year, another bullish technical signal. Support for the indices is at 7,410 ahead of 7,295.
Trading with the Cup and Handle Pattern
FTSE 100 Daily Price Chart – January 5, 2023
| Change in | Longs | Shorts | OI |
| Daily | -30% | 25% | 2% |
| Weekly | -44% | 44% | 0% |
Retail Traders Remain Net Short
Retail trader data shows 17.16% of traders are net-long with the ratio of traders short to long at 4.83 to 1.The number of traders net-long is 1.13% lower than yesterday and 32.23% lower from last week, while the number of traders net-short is 1.51% higher than yesterday and 19.25% higher from last week.
We typically take a contrarian view to crowd sentiment, and the fact traders are net-short suggests FTSE 100 prices may continue to rise. Traders are further net-short than yesterday and last week, and the combination of current sentiment and recent changes gives us a stronger FTSE 100-bullish contrarian trading bias.
What is your view on the FTSE 100 – bullish or bearish?? You can let us know via the form at the end of this piece or you can contact the author via Twitter @nickcawley1.


