FTSE 100, DAX 40, S&P 500 Analysis and Charts
FTSE 100 struggles to recover
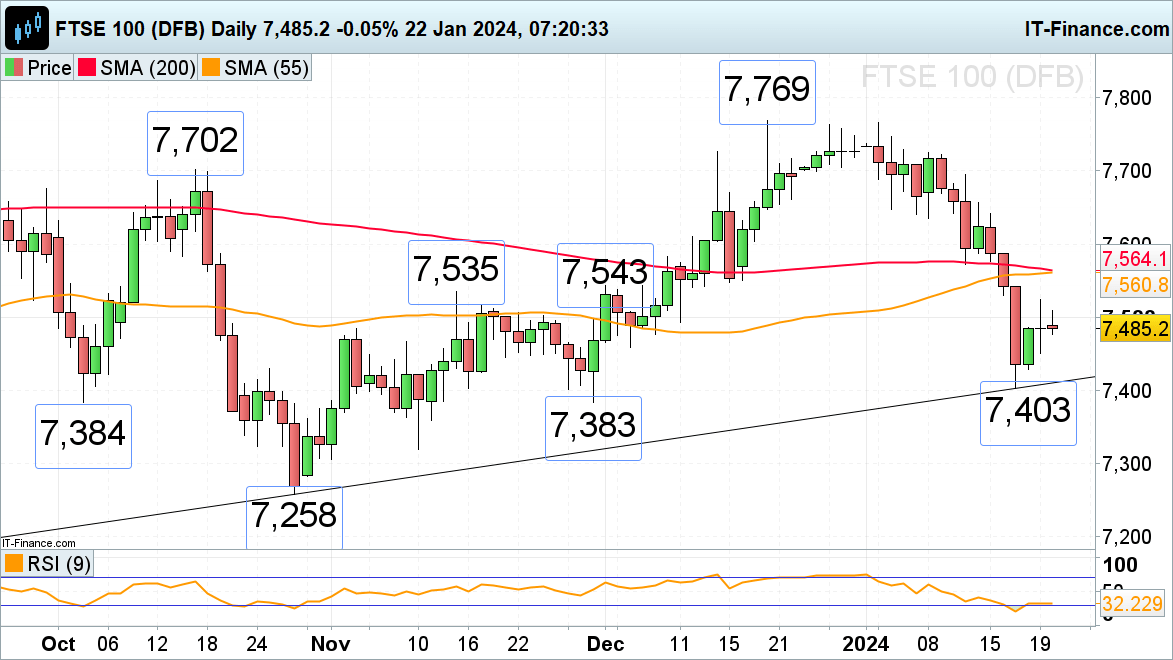
The FTSE 100, which last week fell to a six-week low at 7,403 on pared-back rate cut expectations, is having difficulties in regaining recently lost ground and so far hasn’t managed to overcome the 7,500 mark on a daily chart closing basis.
Above Friday’s 7,523 high beckon the mid-November and early December highs at 7,535 to 7,543 but together with the 55- and 200-day simple moving averages (SMA) at 7,561 to 7,564 might prove difficult to break through.
Minor support below Monday’s 7,476 low lies at the 5 December 7,459 low ahead of last week’s 7,403 trough.
FTSE 100 Daily Chart
| Change in | Longs | Shorts | OI |
| Daily | 13% | -7% | -4% |
| Weekly | -8% | 9% | 5% |
See how daily and weekly IG client sentiment can affect price action:
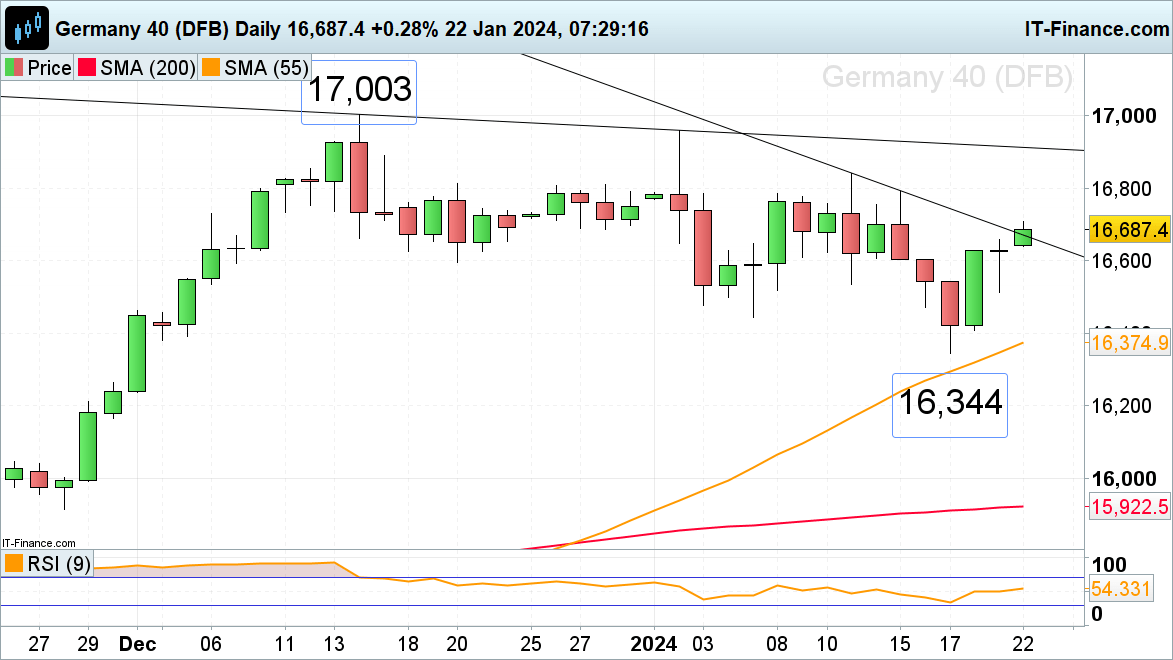
DAX 40 on track for third straight day of gains
The DAX 40 index is in the process of breaking through its January resistance line at 16,670 with the 8 January high at 16,785 and the more significant 11 and 15 January highs at 16,792 to 16,841 representing upside targets.
Minor support below Monday’s 16,638 low can be spotted around Wednesday’s high and the lows from a couple of weeks ago at 16,543 to 16,517.
Further down lie the early January and last week’s low at 16,444 to 16,344.
DAX 40 Daily Chart
Download our free Q1 equity forecast

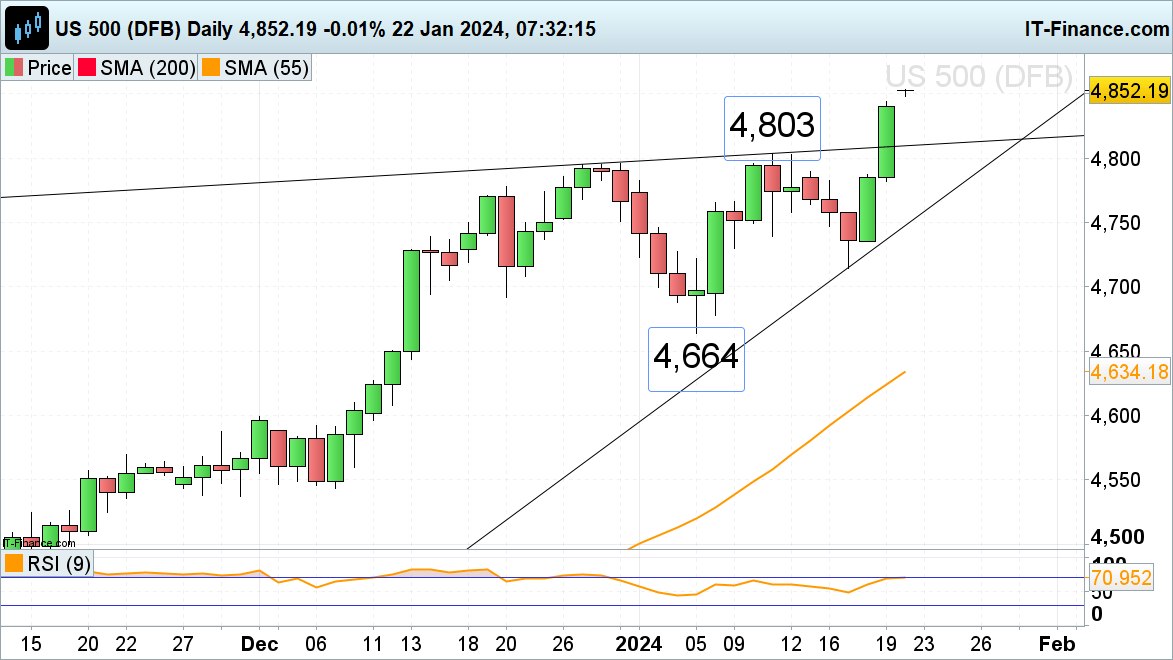
S&P 500 trades in new all-time record high
The S&P 500 last week rallied to a new all-time record high amid stronger-than-expected University of Michigan consumer sentiment which saw its highest reading since July 2021.
The psychological 5,000 mark is thus in focus and may be reached over the coming weeks and months.
Support sits at Monday’s 4,848 to 4,844 price gap and also at the index’s January 2022 previous record high at 4,817.
S&P 500 Daily Chart