


FTSE 100 Reaches New High as Resilient Earnings Fuel Sentiment
- FTSE 100 records another fresh all-time high as resilient earnings boost UK equities.
- BT Group PLC, Persimmon and BP lead gains.
- The analysis in this article makes use of chart patterns and key support and resistance levels. For more information visit our comprehensive education library.

FTSE 100 Boosted by Upbeat Earnings
The FTSE 100 has reached a fresh all-time high of 7934.3, bolstered by upbeat earnings and renewed optimism of a near-term Fed pivot. Following the release of record Q4 2022 profits for oil giants BP and Shell, the UK blue-chip index opened higher, swiftly rising above prior psychological resistance at 7900.
With UK housebuilder Barratt developments reporting a 15.9% rise in half-year profits, the NIESR (National Institute of Economic and Social Research) adding to the positive boost in sentiment by suggesting that the UK may be able to avoid a severe recession.
Since a technical recession is defined as two consecutive quarters of contraction, Friday’s GDP data may serve as an additional catalyst for price action.
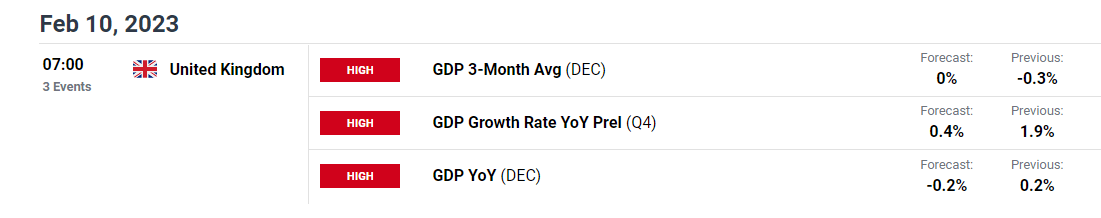
DailyFX Economic Calendar
Meanwhile, after UBS followed JP Morgan in upgrading the target price for BT Group PLC (from 130 – 135P), the telecommunications company is currently trading 3.66% higher on the day, leading FTSE gains.
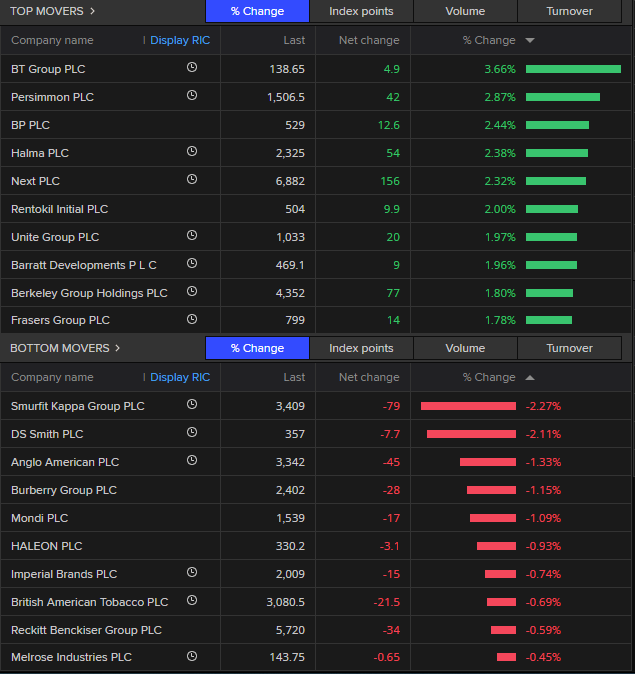
Source: Refinitiv
Upcoming Earnings: 09 February 2023 (9.00am GMT)
- AstraZeneca PLC - Q4 2022 earnings release
- British American Tabacco PLC – Full year (2022) earnings release
- Unilever PLC – Full year (2022) earnings release
| Change in | Longs | Shorts | OI |
| Daily | -8% | -1% | -2% |
| Weekly | 25% | 3% | 6% |
FTSE 100 Technical Analysis
After rising above the 2018 prior all-time high of 7903.5 in Friday’s session, FTSE prices rose slightly before peaking at a level of 7906.58.
With the release of January US NFP (non-farm payrolls) highlighting an overly tight labor market (517K jobs were added in Jan), expectations of further Fed tightening limited gains, driving prices back towards 7900.
FTSE 100 Weekly Chart
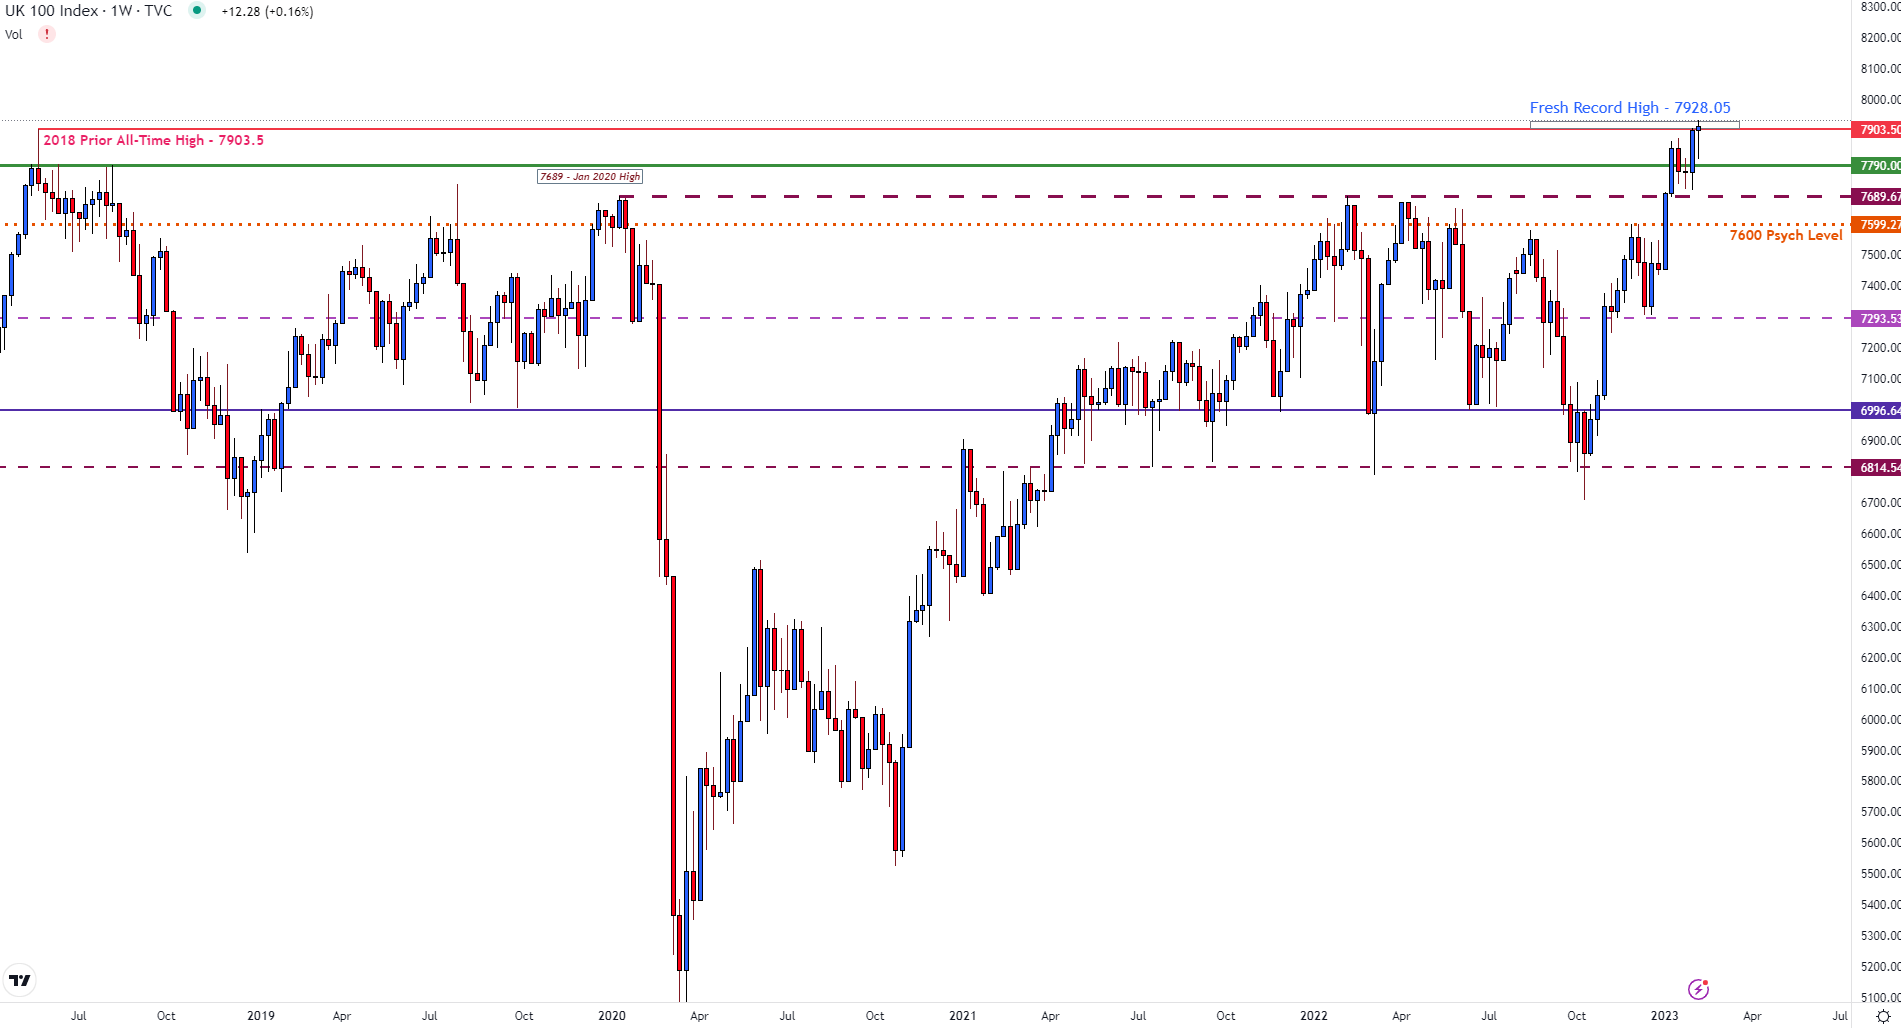
Chart prepared by Tammy Da Costa using TradingView
As expectations of further rate hikes lifted the safe-haven Dollar, risk assets eased, pushing FTSE below the January high of 7875.58.
In Monday's session, the major UK index remained under pressure, dropping to a low of 7808.39. Ahead of Tuesday's commentary from Fed Chair Jerome Powell, investors remained cautious, driving price action into a range between 7835 (daily open) and 7864 (daily close).
While Powell acknowledged the resilience of the labor market, he also suggested that inflation may have peaked. With investors repricing in the slower rate hikes, prices edged higher, before peaking at 7890.
After a rejection of the upper wick at prior resistance, the formation of an inverted appear appeared on the daily chart. In technical analysis, the formation is a bullish reversal pattern that occurs after a slight pause in the uptrend.
FTSE 100 Daily Chart
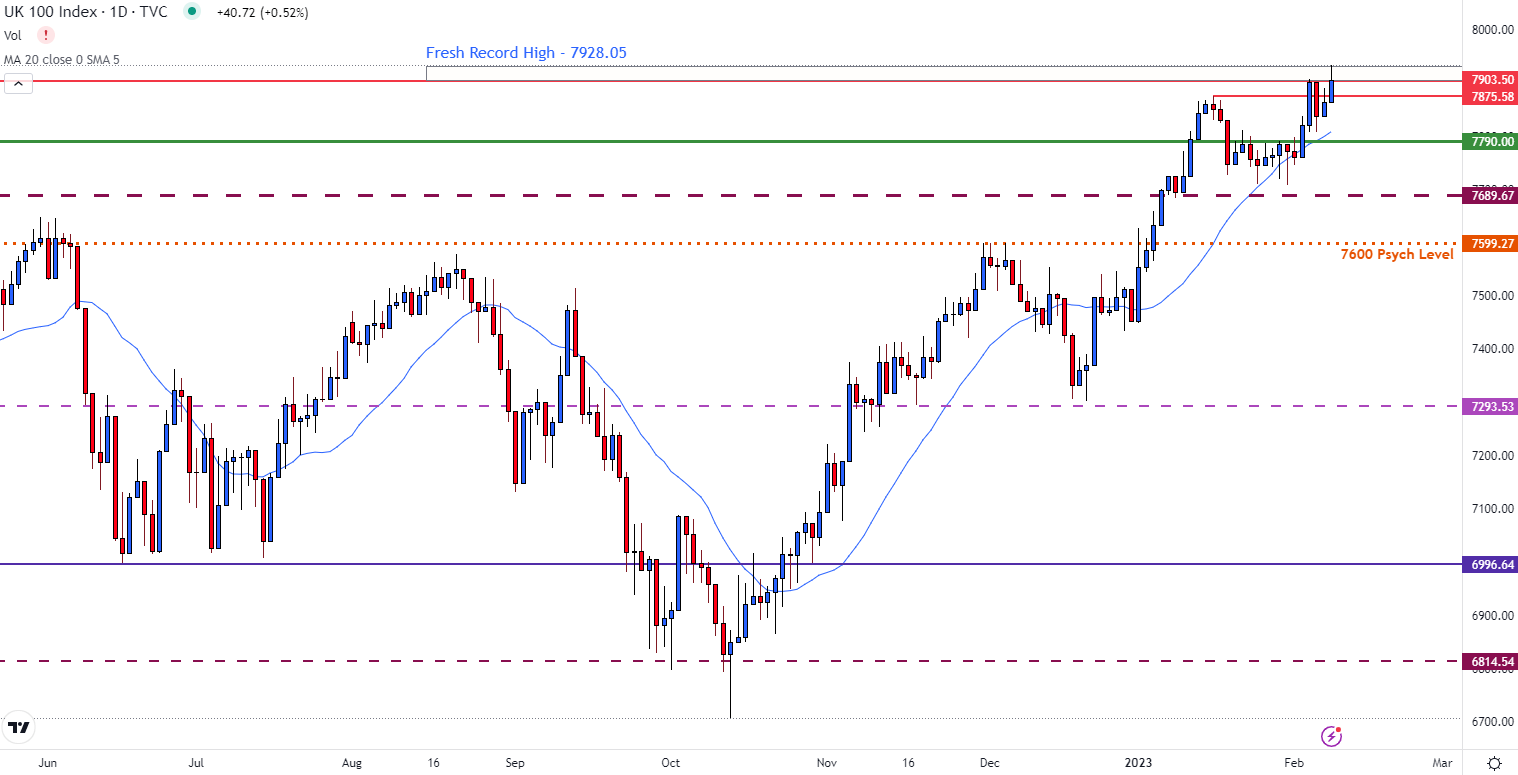
Chart prepared by Tammy Da Costa using TradingView
But, after BP PLC and Shell announced better-than expected earnings, FTSE ripped higher on Wednesday's open, driving the breakout that allowed FTSE to achieve another record high.
Looking ahead, the remainder of the week could pose a challenge to FTSE bulls. If earnings over the remainder of the week weaken, recession fears could rise, driving prices lower. If FTSE falls back below 7875, a retest of the current weekly low of 7808.39 could fuel bearish momentum back toward the next level of support at 7890.
Trade Smarter - Sign up for the DailyFX Newsletter
Receive timely and compelling market commentary from the DailyFX team
--- Written by Tammy Da Costa, Analyst for DailyFX.com
Contact and follow Tammy on Twitter: @Tams707


