


Major Indices Updates:
- FTSE 100 continues to be side-lined
- DAX 40 dips but tries to regain lost ground
- S&P 500 trades in new record highs

FTSE 100 continues to be side-lined
The FTSE 100 is stuck in its 7,690 to 7,600 sideways trading range, the break out of which may well determine the next minor trend.
A fall through last week’s 7,600 low would lead to the 55-day simple moving average (SMA) at 7,592 being eyed, below which meanders the 200-day SMA at 7,550.
Minor resistance can be found at last Tuesday’s 7,641 low above which lies last week’s high at 7,690. A rise above 7,690 and the 11 January high at 7,694 would likely target the mid-October high at 7,702. Further up the July and September highs can be seen at 7,723 to 7,747.
As long as last week’s low at 7,600 underpins, the medium-term uptrend remains intact.
FTSE 100 Daily Chart
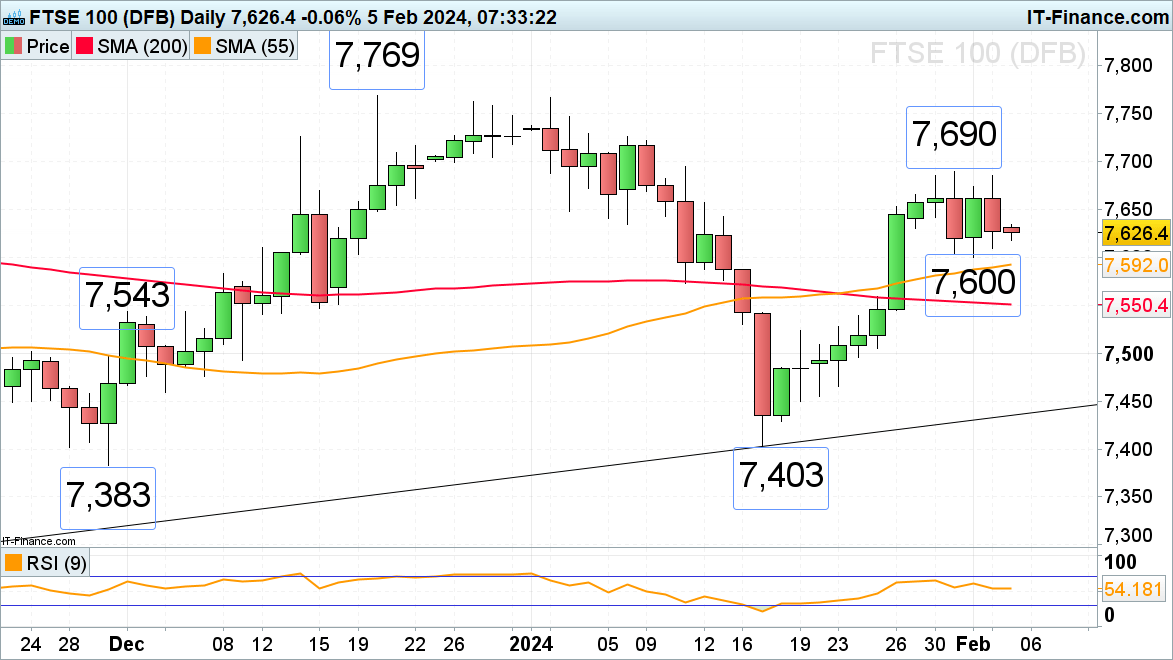
Source: IG ProRealTime, Prepared by Axel Rudolph
DAX 40 dips but tries to regain lost ground
The DAX 40 index dipped to its January-to-February uptrend line at 16,856 in overnight trading before recovering some lost ground and heading back up to its Monday 16,943 high. Above it beckon the mid-December and early February record highs at 17,003 to 17,020.
Above 17,020 lies the 17,100 mark which may be reached next. This high will be eyed provided no bearish reversal to below last Thursday’s low at 16,782 is seen.
Support above that low sits at Friday’s 16,889 low.
DAX 40 Daily Chart
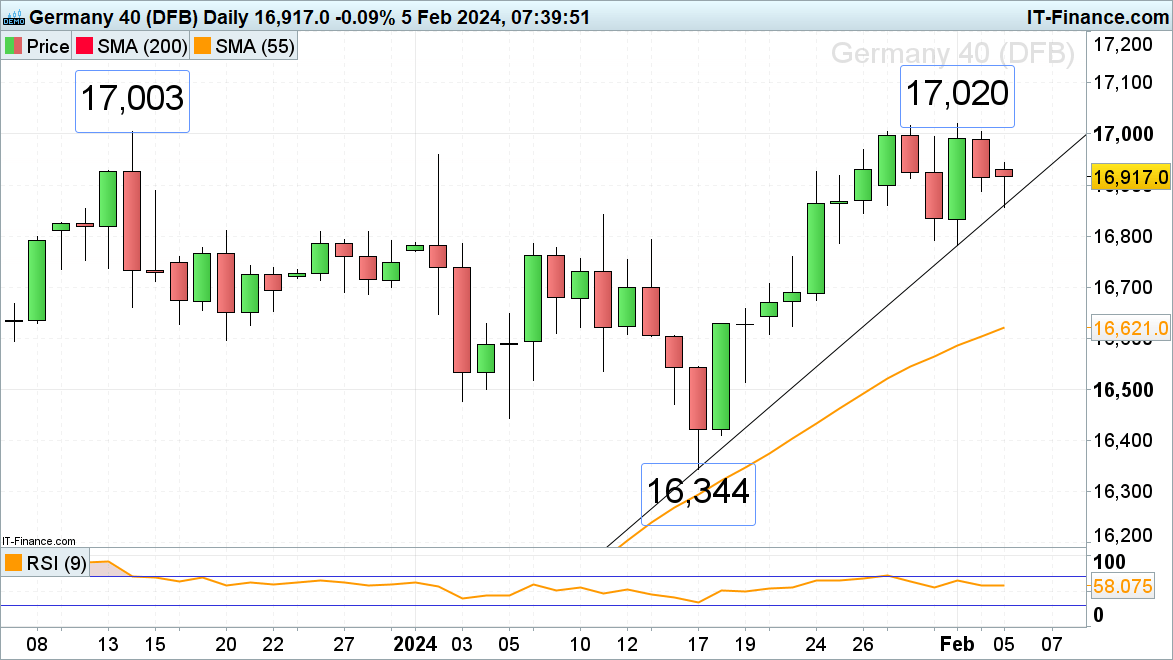
Source: IG ProRealTime, Prepared by Axel Rudolph

S&P 500 trades in new record highs
The S&P 500 continues to steam ahead and is fast approaching its psychological 5,000 mark around which it is expected to at least short-term lose upside momentum.
Slips should find support around last Monday and Tuesday’s 4,931 high ahead of Friday’s 4,905 low. Slightly further down sits solid support between Tuesday’s 4,899 low and the 4,903 late January high.
S&P 500 Daily Chart
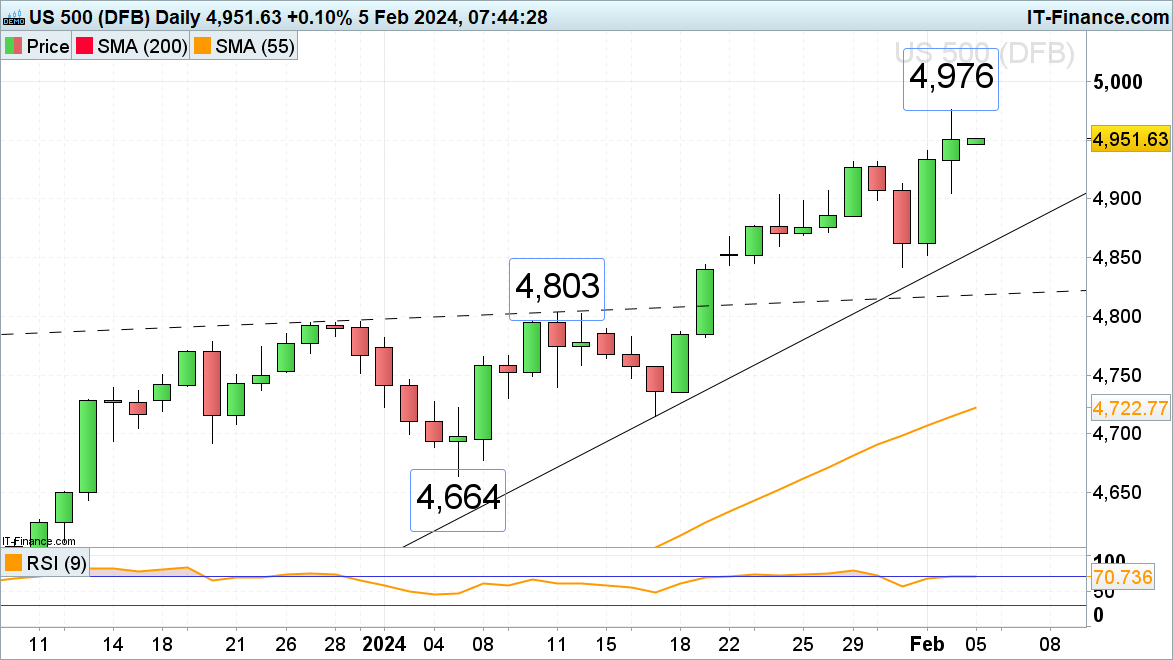
Source: IG ProRealTime, Prepared by Axel Rudolph


