FTSE 100, DAX 40, and S&P 500 Analysis and Charts
Article written by IG Senior Market Analyst Axel Rudolph
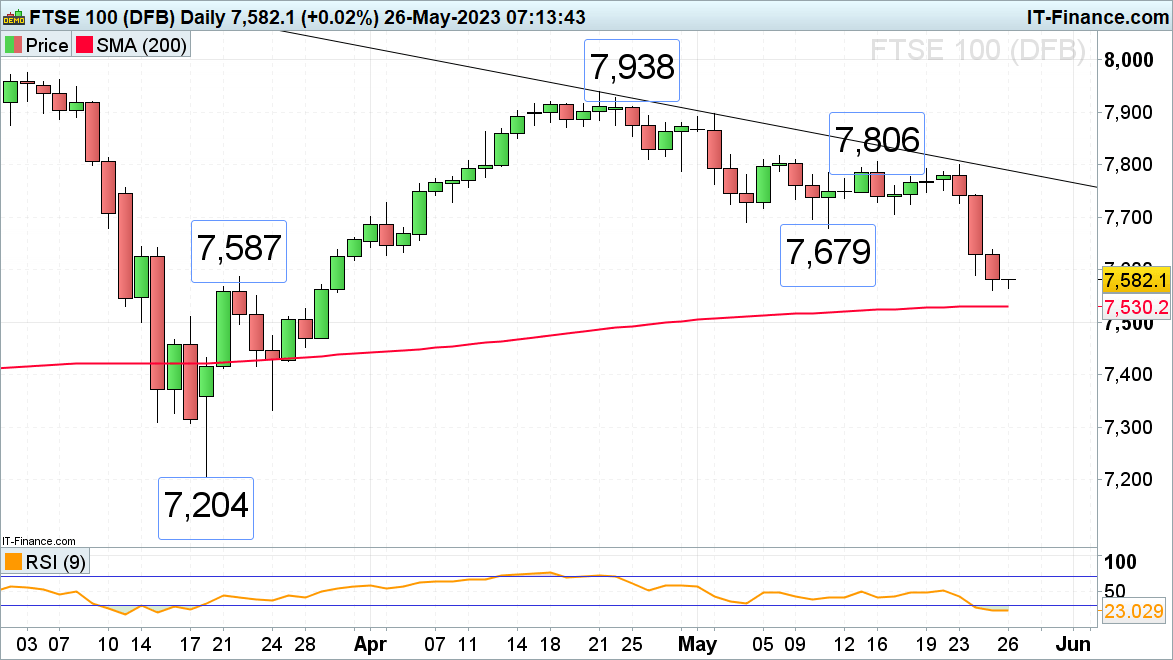
FTSE 100 remains under pressure amid ongoing US debt ceiling negotiations
The FTSE 100 has given back around 2.5% by falling on three consecutive days as a possible US default is getting increasingly likely since no agreement on raising the debt ceiling limit has been reached yet.
The 22 March high at 7,587 has been reached to date with the 200-day simple moving average (SMA) at 7,530 representing the next downside target around which the index may at least short-term stabilise. If not, the March trough at 7,204 would be back in sight.
Minor resistance can be spotted at Thursday’s 7,638 high.
FTSE 100 Daily Price Chart

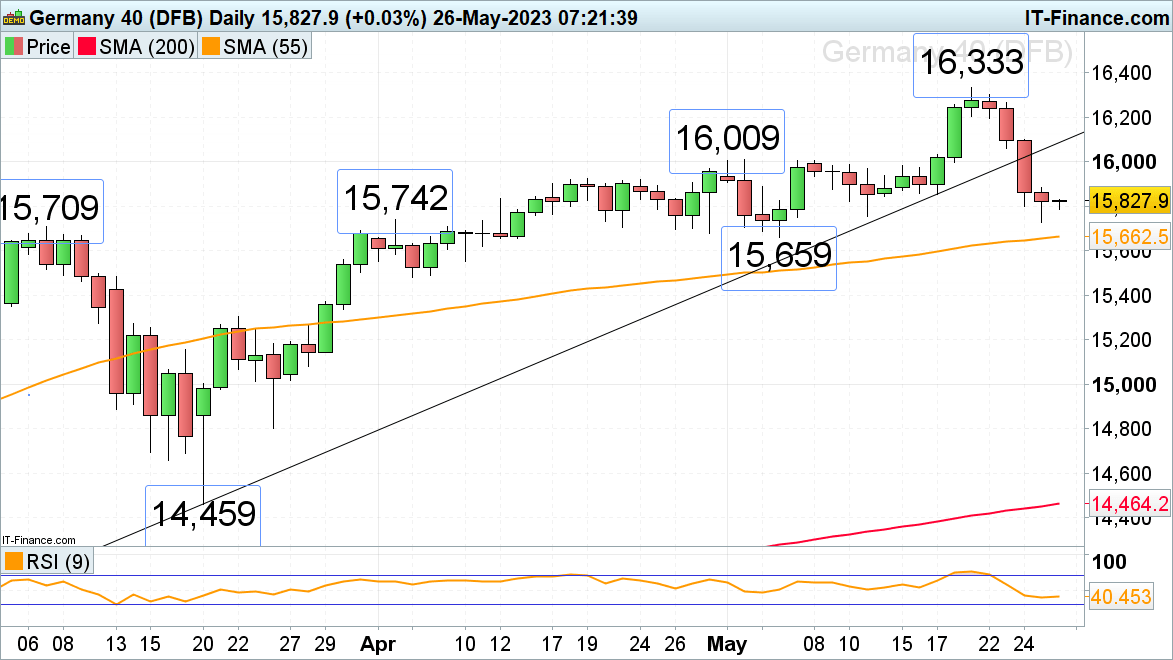
DAX 40 found interim support above its early May low
The DAX 40 dropped close to its early May low at 15,659 on Thursday as Germany officially slid into a recession and as US debt ceiling negotiation worries led to risk-off sentiment.
As long as the 15,659 low holds on a daily chart closing basis, the medium-term up- to sideways trend remains intact with the early May high at 16,009 representing a possible upside target.
Were 15,659 to give way, the55-day simple moving average (SMA) at 15,662 would be eyed, together with the 22 March high at 15,304.
DAX 40 Daily Price Chart
Trade Smarter - Sign up for the DailyFX Newsletter
Receive timely and compelling market commentary from the DailyFX team
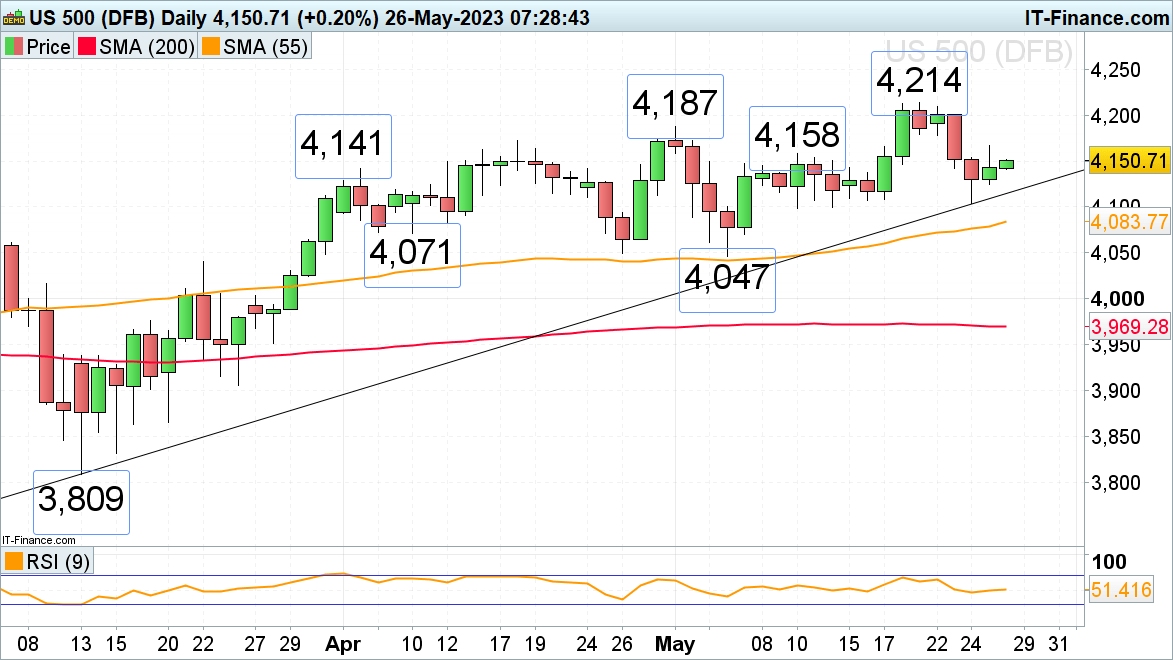
S&P 500 tries to hold above this week’s low amid ongoing US debt negotiations
The S&P 500 managed to bounce off this week’s low at 4,104 on much better-than-expected earnings and guidance from Nvidia which propped up the index.
In case of Thursday’s high at 4,166 being exceeded, the 4,187 early May high could be revisited, above which lurks its nine-month high at 4,214.
Minor support can be spotted along the March-to-May uptrend line at 4,114 and at this week’s 4,104 low. If slipped through, the 55-day simple moving average (SMA) at 4,084 and the 10 April low at 4,071 would be next in line. Further down sits key medium-term support at 4,047.
S&P 500 Daily Price Chart