FTSE 100, DAX 40, and S&P 500 Prices, Charts, and Analysis
Article by IG Senior Market Analyst Axel Rudolph
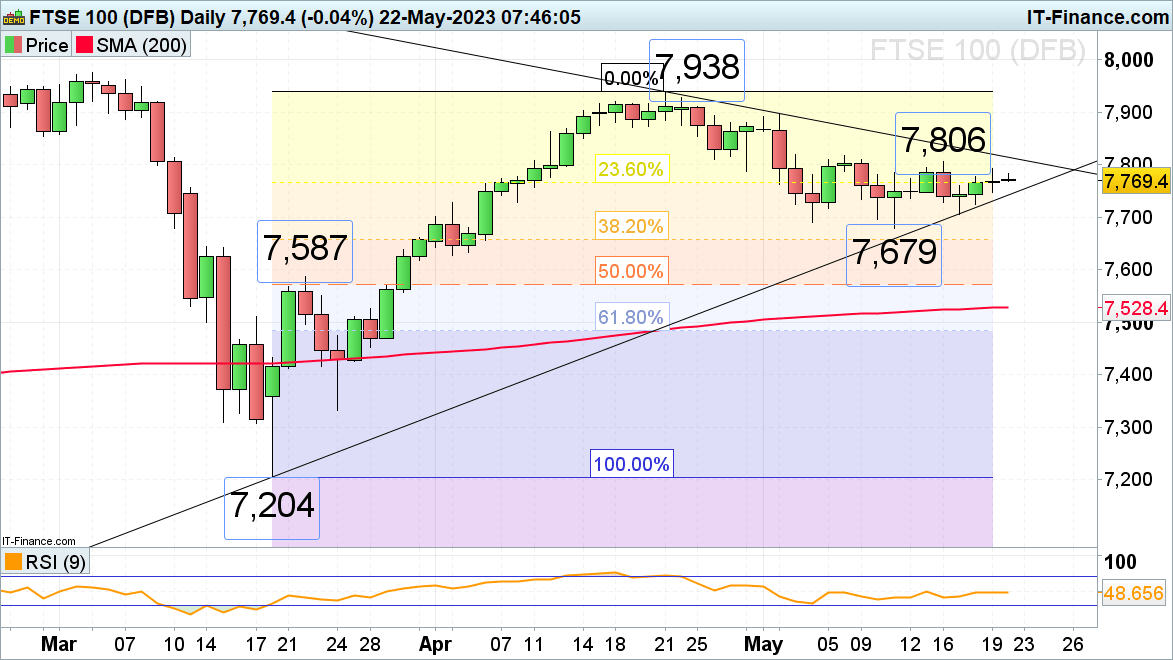
FTSE 100 remains within a sideways trading range
The FTSE 100 tries to rise back to last week’s high at 7,806 amid ongoing optimism regarding negotiations over the US debt ceiling with US president Biden and Republican leader McCarthy meeting today.
A rise and daily chart close above last Tuesday’s high at 7,806 and last week’s high at 7,817 is needed for the bulls to be back in control. An advance above these levels could propel the UK blue chip index towards the 8,000 region.
Slips should find support along the March-to-May support line at 7,742 with the early and mid-May lows at 7,689 to 7,679 offering further potential support. A little lower sits the 38.2% Fibonacci retracement of the March advance at 7,657. While this level holds, the medium-term uptrend from the March low remains intact.

FTSE 100 Daily Price Chart - May 22, 2023
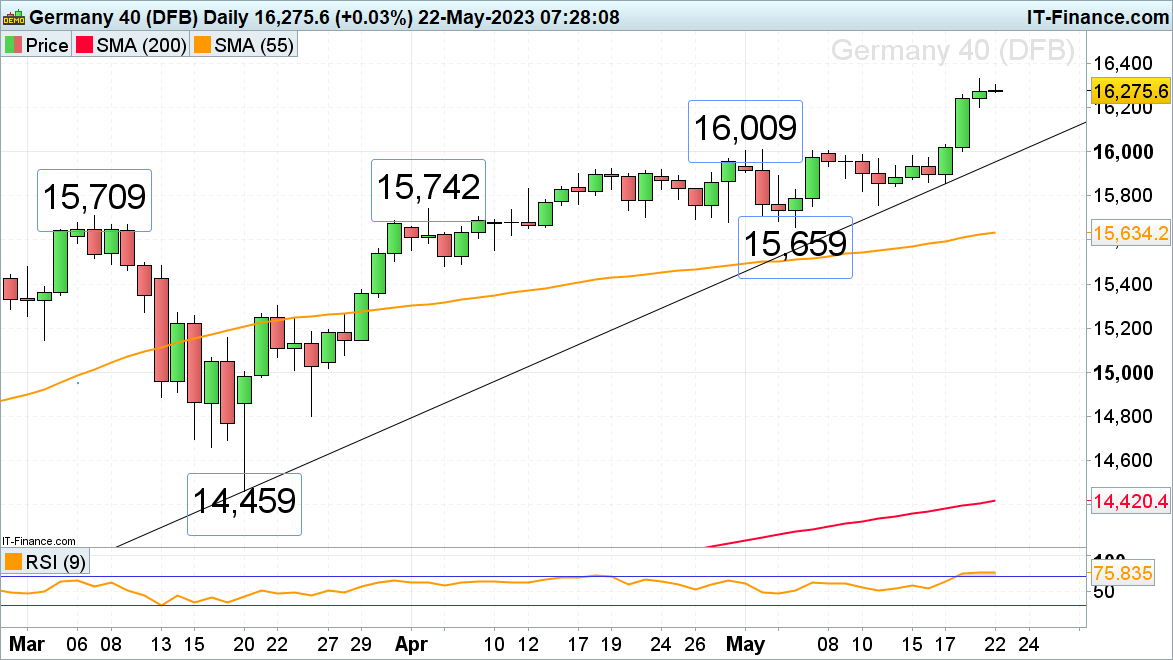
DAX 40 trades close to all-time record highs
The DAX 40 trades close to last week’s all-time record high amid ongoing US debt ceiling negotiations.
Upside momentum is slowing ahead of Eurozone consumer confidence data which is expected to be published at 3pm on Monday.
Were last week’s peak at 16,333 to be exceeded, the 16,500 region could be targeted next.
The only support to speak of below Friday’s low at 16,203 lies between the early to mid-May highs at 16,009 to 16,005.

DAX 40 Daily Price Chart - May 22, 2023
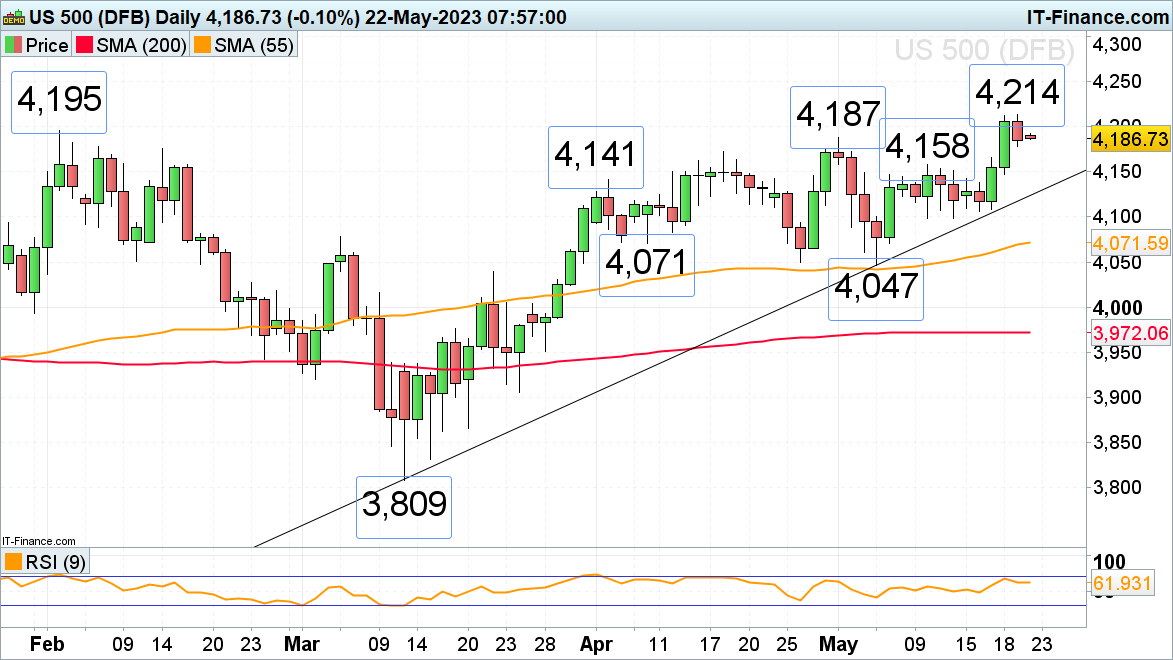
S&P 500 comes off its nine-month highs
Last week the S&P 500 managed to rise above its 4,195 February peak to a nine-month high as market sentiment improved.
Since then, the index has given back some of its gains as US Secretary of the Treasury Janet Yellen told bank CEOs that more bank mergers may be necessary, and re-emerging worries about the US debt ceiling negotiations dampened the mood.
In Monday morning’s overnight session, the S&P 500 revisits its 4,187 early May high which may offer initial support. Below it the early April and 10 May highs at 4,158 to 4,141 may also provide support.
A rise and daily chart close above the 4,214 high seen last week would clear the way for the August 2022 peak at 4,325.
S&P 500 Daily Price Chart - May 22, 2023