


Article by IG Senior Market Analyst Axel Rudolph
FTSE 100, DAX 40, S&P 500 PRICES, ANALYSIS, AND CHARTS
Trade Smarter - Sign up for the DailyFX Newsletter
Receive timely and compelling market commentary from the DailyFX team
FTSE 100 revisits 200-day simple moving average
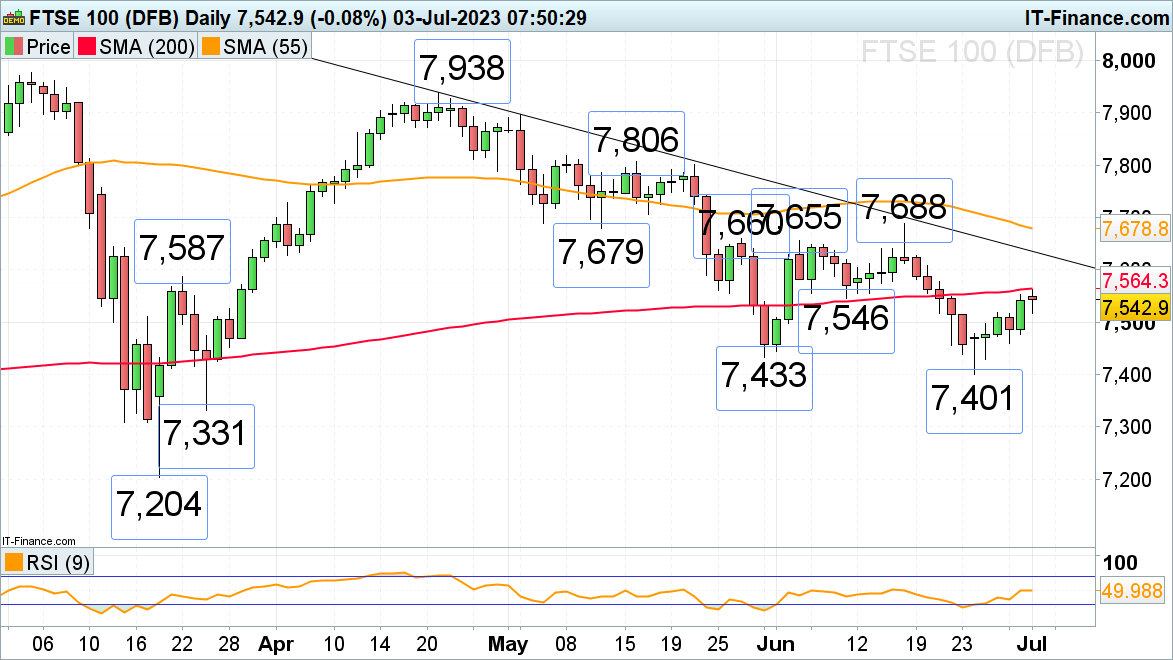
The FTSE 100 managed to finish last week and month on a positive note but still ended the quarter in negative territory as it continues to underperform its peers.
Last Friday’s positive US PCE inflation data, the Federal Reserve’s (Fed) preferred inflation gauge, pushed global stock markets higher with the FTSE 100 reaching the 200-day simple moving average (SMA) at 7,564 on Monday morning’s overnight session. It will need to be overcome for further upside towards the April-to-July downtrend line at 7,635 to be in sight.
Slips should find support around the 28 June high and Monday’s intraday low at 7,519 to 7,516, below which further support sits at the 29 June 7,459 low.
FTSE 100 DAILY PRICE CHART
DAX 40 continues to rise on positive sentiment
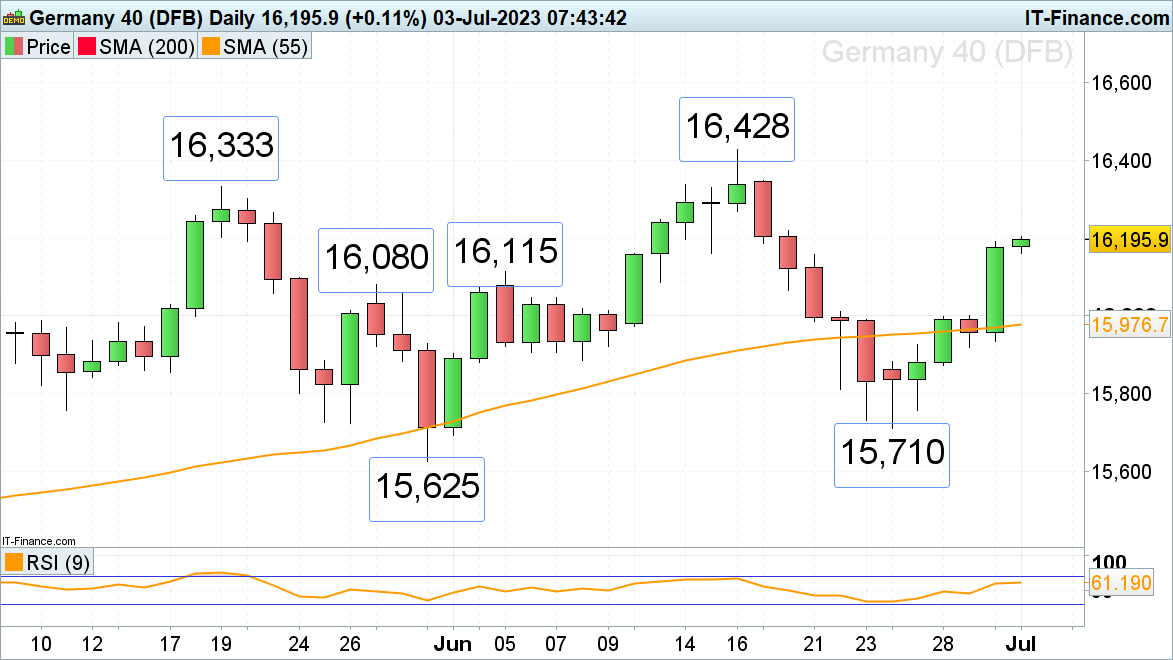
The DAX 40 shot up strongly at the end of last week to finish the second quarter on a high but is expected to lose upside momentum at the beginning of this week as trading volumes may well thin out with US markets being shut for the 4th of July holiday on Tuesday.
Nonetheless the May peak at 16,333 remains in view ahead of the June peak at 16,428.
In case of a minor retracement lower taking shape, the late May and early June highs at 16,115 to 16,080 should offer at least initial support.

DAX 40 DAILY PRICE CHART
S&P 500 trades in 15-month highs
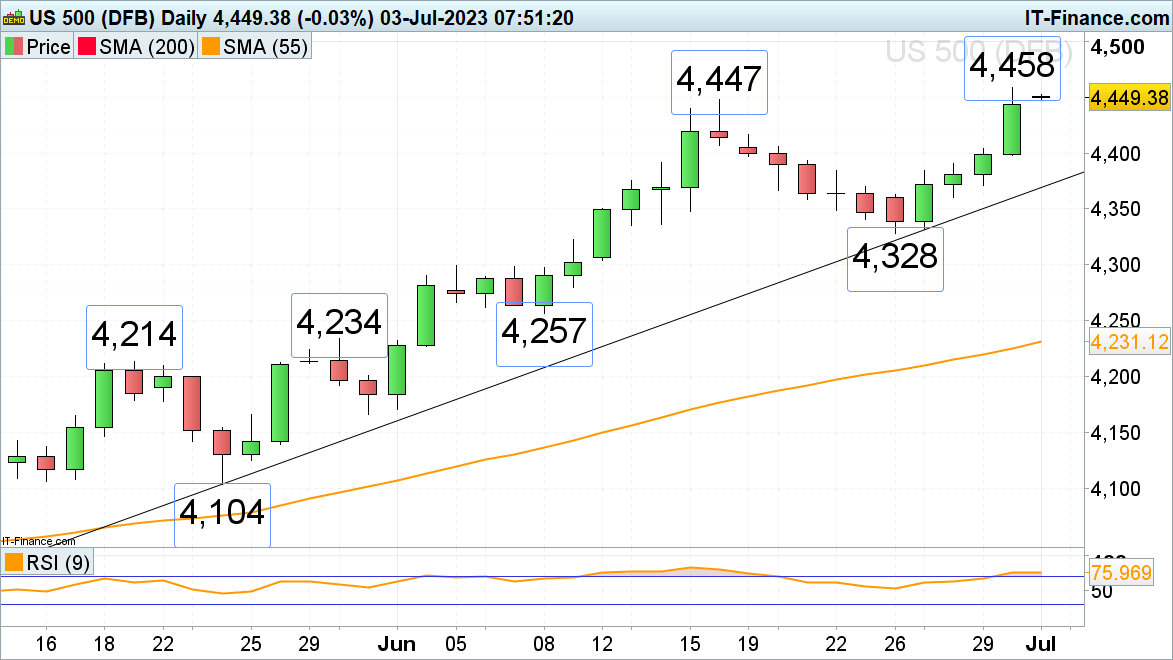
The S&P 500 continues to head higher as solid economic data and slowing inflationary pressures led to renewed risk-on sentiment last week.
The April 2022 high at 4,513 represents a possible upside target while last Friday’s low at 4,398 underpins on a daily chart closing basis.
Immediate support comes in around the 4,447 June peak.
S&P 500 Daily Price Chart
Foundational Trading Knowledge
Understanding the Stock Market
Recommended by IG


