Article written by IG Senior Market Analyst Axel Rudolph
FTSE 100, DAX 40, S&P 500 - Analysis, Prices, and Charts
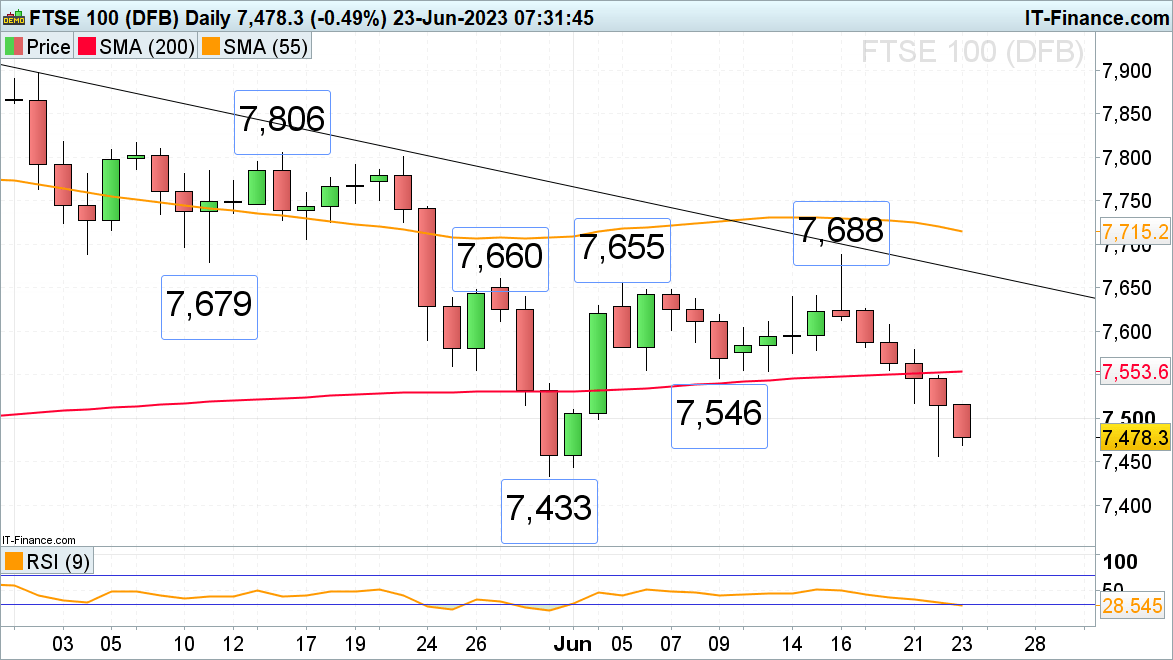
FTSE 100 back in negative territory year-to-date
The FTSE 100 is on track for its fifth consecutive day of losses. It has been slipping since last Friday’s five-week high and is expected to open lower as Asian indices decline because hawkish central banks weigh on sentiment.Thursday’s low at 7,457 is within reach, a fall through which will put the May low at 7,433 back on the map.
Only a bullish reversal and rise above Wednesday’s low at 7,518 could put the 200-day simple moving average (SMA) at 7,553 back on the cards. While remaining below it, further downside is likely to be seen.
FTSE 100 Daily Price Chart
Trade Smarter - Sign up for the DailyFX Newsletter
Receive timely and compelling market commentary from the DailyFX team
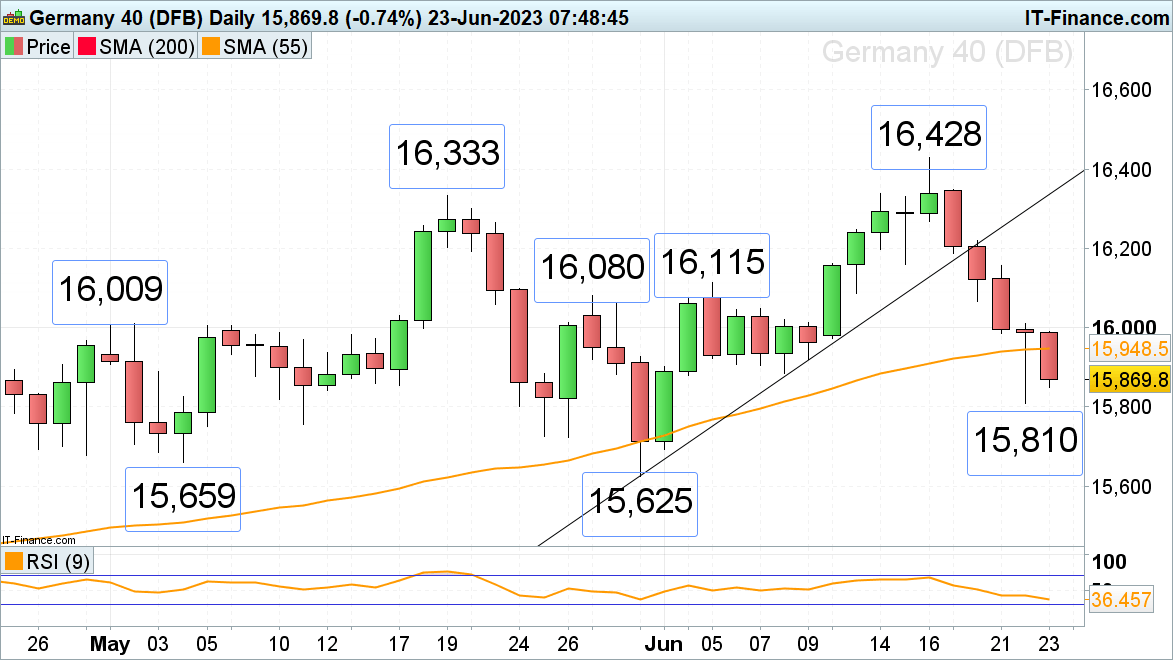
DAX 40 on track for fifth day of losses
The DAX 40 has come off Friday’s new all-time record high as investors fret about the impact higher interest rates will have on the economy. The index is on track to decline for a fifth consecutive day and nears Thursday’s low at 15,810. A slip through it would push the 26 May low at 15,723 to the fore, below which sits key support between the May-to-June lows at 15,659 to 15,625.
Resistance above the 55-day simple moving average (SMA) at 15,948 can be seen at Wednesday’s trough at 15,986.
DAX 40 Daily Price Chart

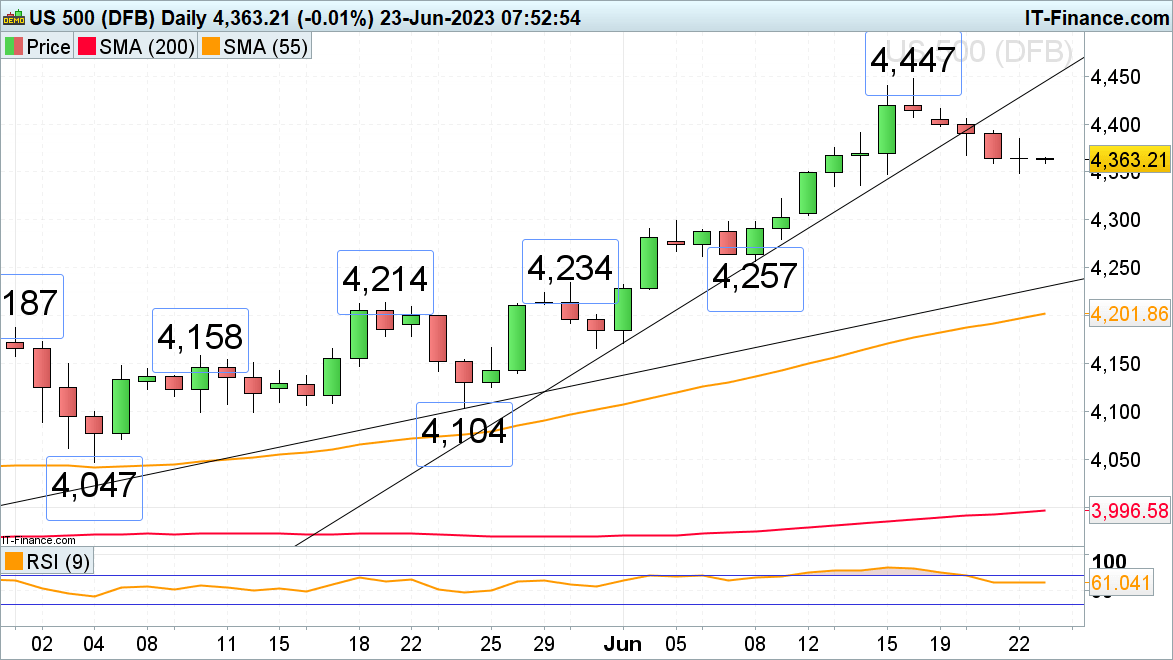
S&P 500 continues to drift lower
The S&P 500 has been declining from its 14-month high at 4,447 for the past five consecutive days on risk-off sentiment.
Failure at Thursday’s 4,349 low would engage the 4,336 mid-June low, below which lies the early June high at 4,300.
Minor resistance is to be found around the minor psychological 4,400 mark and at Tuesday’s high at 4,405.
S&P 500 Daily Price Chart