


OIL PRICE FORECAST:
- Oil Mixed Today Following an Improved European and US session as Sentiment briefly improved.
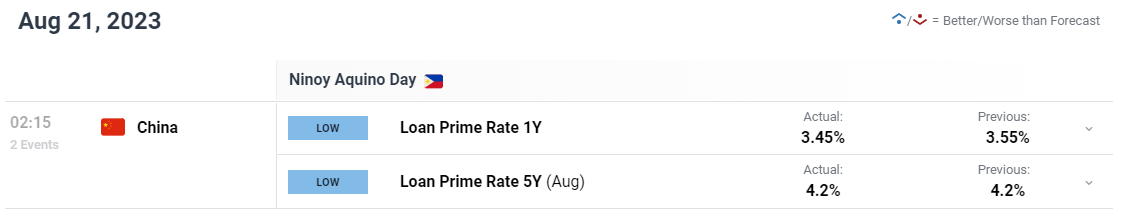
- US Rig Count for Week Ended August 18 Drops to 520 from a Previous 525.
- Technicals Flashing Mixed Signals with Overall Improvement in Sentiment needed for a Sustained Push Higher.
- To Learn More About Price Action, Chart Patterns and Moving Averages, Check out the DailyFX Education Section.
Free Guide to Oil for Q3 Below Now

Most Read: What is OPEC and What is Their Role in Global Markets?
Oil prices finished last week strong with WTI putting in a gain of around 1.7% on Friday, helped in part by a lower rig count in the US. This morning did see a brief continuation of the rally higher as concerns around China were largely drowned out by tighter supply dynamics as exports from Russia and Saudi Arabia slow down.
US RIG COUNT AND CHINA CONCERNS
The Baker Hughes rig count in the US for the week ending August 18 showed a decline from the previous 525 to 520 in a sign production may be slowing in the US. This comes on the back of reports last week of a surge in US oil exports which makes the print even more intriguing.
The environment in China remains a key challenge with a modest if uninspiring rate cut from the PBoC did improve sentiment a smidge in the London and Asian sessions. The US open has seen the script somewhat shift as risk assets retreat and a stronger US Dollar appears to be dragging oil prices lower as well.
A slowdown in China could have far reaching consequences for Global Markets in the second half of 2023. The first half of the year saw the Chinese economy largely underwhelm and yet their oil purchases reached historic levels as they look to improve stockpiling capabilities. However, a slowdown may see such purchases take a backseat from the Chinese government and in tun this could cause oversupply and continue to keep Oil prices relatively subdued.
Some Tips on How to Trade Oil in the Free Guide Below

US DATA, RISK EVENTS AND JACKSON HOLE
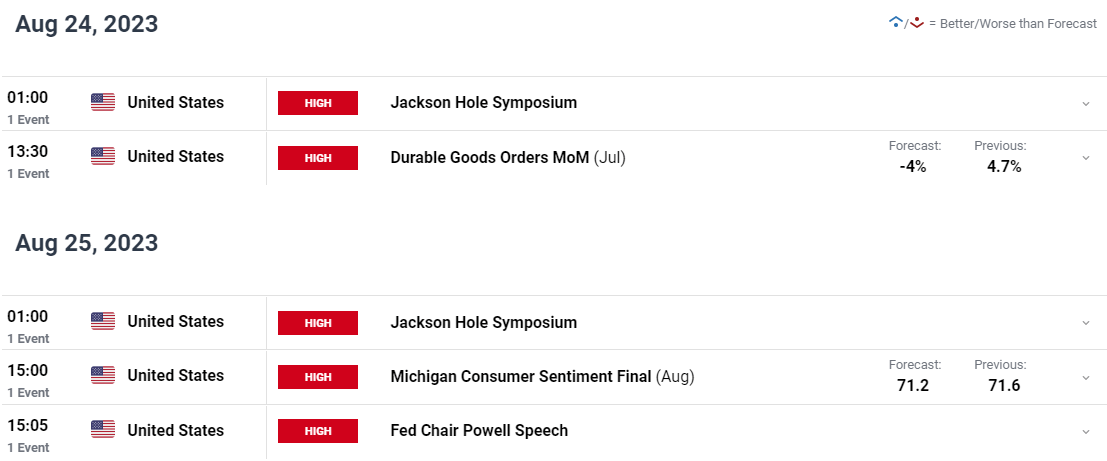
The key heading to start the week is likely to be driven by the Jackson Hole Symposium which kicks off on Thursday. As things stand, we do not have a lot on the calendar in terms of risk events, but PMI data could play a role in oil prices this week as well.
The S&P global manufacturing flash PMI data could give Oil traders some more insight into the health of the global economy. Obviously, a decline in manufacturing activity could reinforce recession fears and push all lower once more.
For all market-moving economic releases and events, see the DailyFX Calendar
TECHNICAL OUTLOOK AND FINAL THOUGHTS
From a technical perspective both WTI and Brent finished last week strong with price action almost identical of late. WTI for its part has attempted a rebound and run into resistance just above the $82.00 a barrel mark. We also have the 20-day MA which rests at the $81.32 a barrel mark which held firm thus far today.
WTI is providing mixed signals from a technical viewpoint as we seem primed for another Golden Cross Pattern as the 50-day MA eyes a cross above the 200-day MA. This chart pattern is usually a positive sign for bulls, even if it is temporary.
Key Levels to Keep an Eye On:
Support levels:
- 80.00 (psychological level)
- 79.15
- 77.50
Resistance levels:
- 82.00
- 83.80
- 85.00
WTI Crude Oil Daily Chart – August 21, 2023
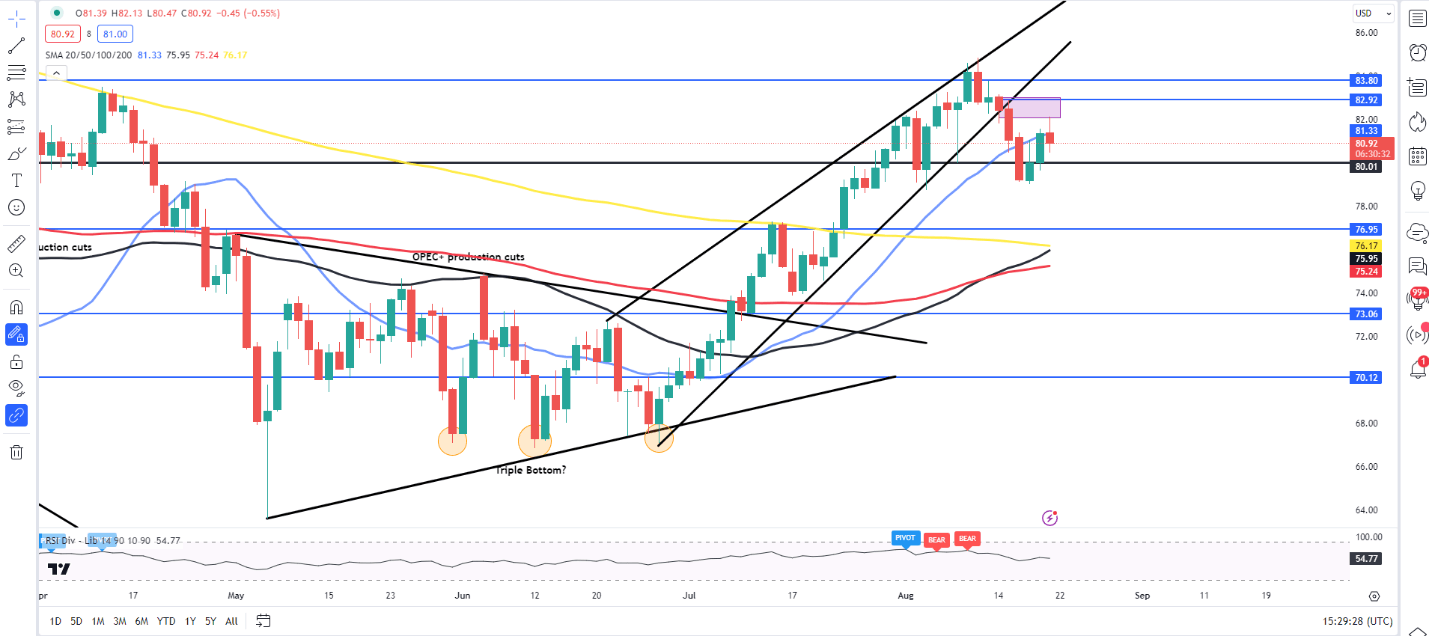
Source: TradingView
Brent Crude is beginning to look like a mirror image of WTI with the MAs and price action almost moving in sync at the minute.
IG Client Sentiment data tells us that 53% of Traders are currently holding short positions. the number of traders long to short are 1.12 to 1.
For a more in-depth look at WTI/Oil Price sentiment and the changes in long and short positioning, download the free guide below.
| Change in | Longs | Shorts | OI |
| Daily | 7% | -17% | 1% |
| Weekly | -5% | -5% | -5% |
Brent Oil Daily Chart – August 21, 2023
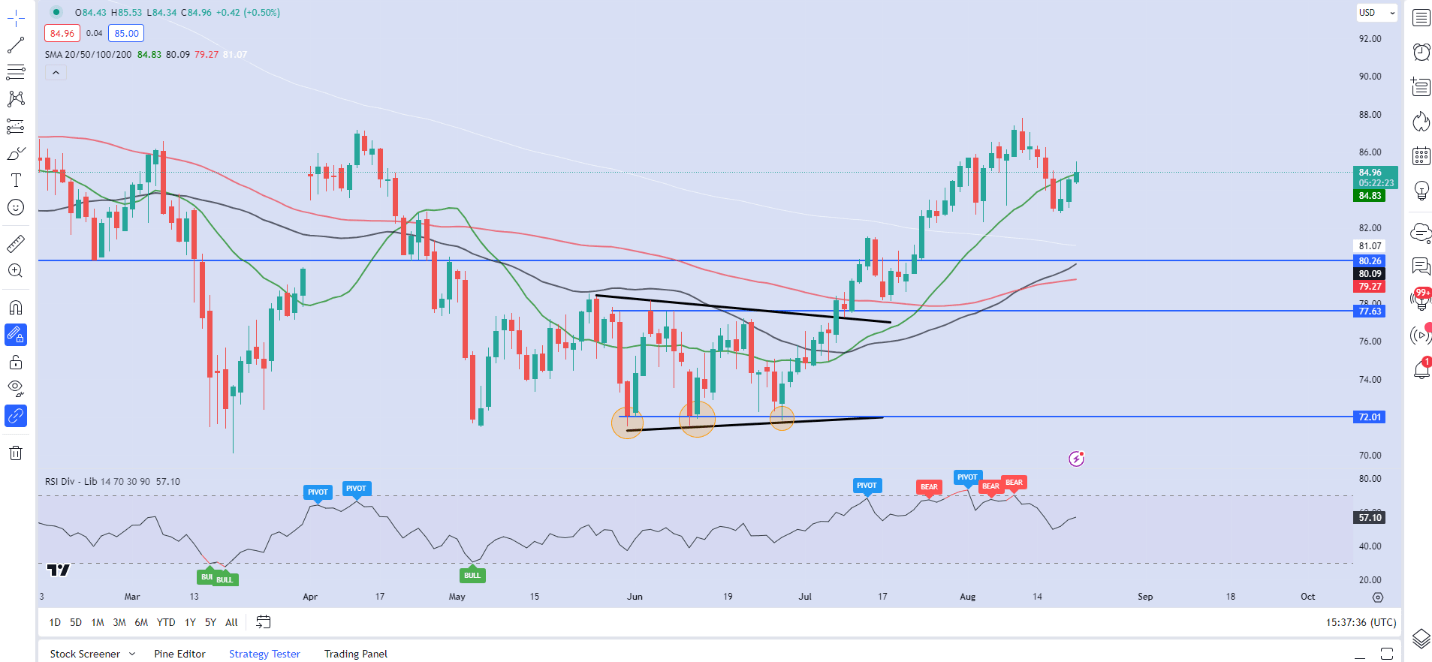
Source: TradingView
Written by: Zain Vawda, Market Writer for DailyFX.com
Contact and follow Zain on Twitter: @zvawda


