
US DOLLAR OUTLOOK – EUR/USD, USD/JPY, USD/CAD
- U.S. dollar, via the DXY index, eases off multi-month highs as global yields soar
- The spotlight this week will be the release of the March U.S. jobs report
- This article explores the technical outlook for EUR/USD, USD/JPY and USD/CAD
Most Read: US Dollar Rallies, EUR/USD Slumps, Gold Continues to Push Ever Higher
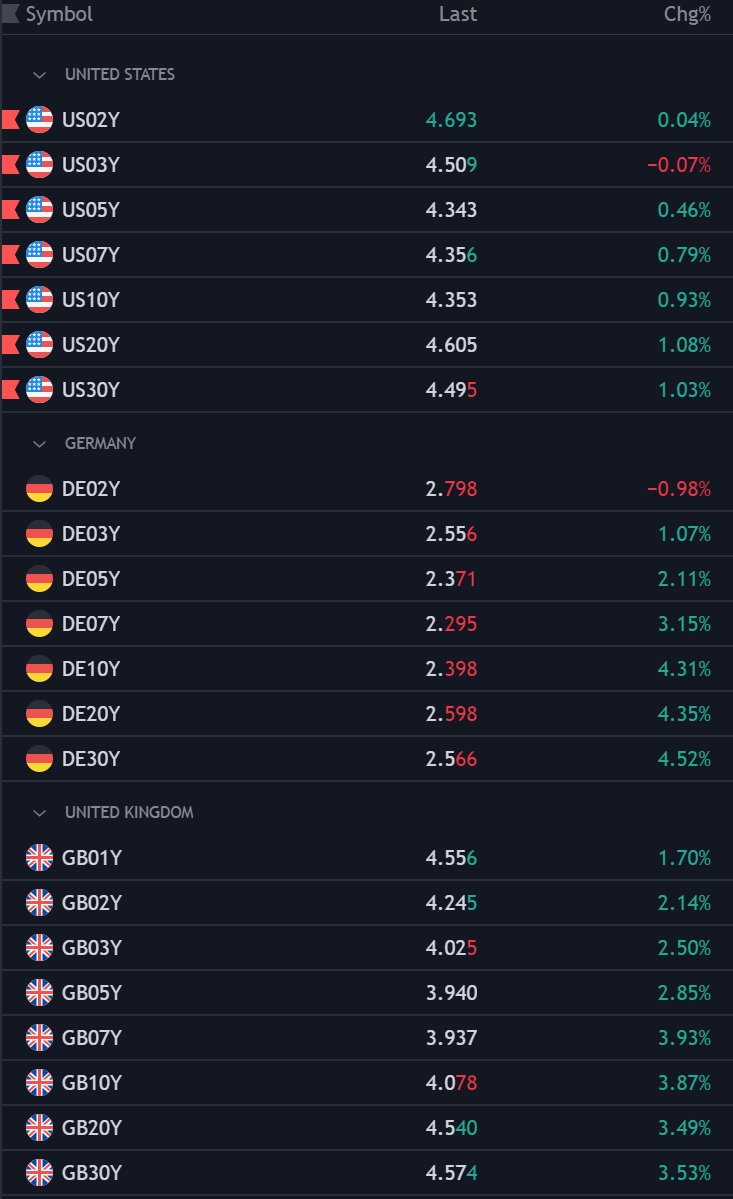
The U.S. dollar, as measured by the DXY index, fell on Tuesday (-0.2% to 104.75), stepping back from a 5-month peak established in the overnight session. While government rates were mostly higher on the day, the greenback was unable to capitalize from this trend, as global yields, such as those from Germany and the UK, moved up more vigorously, playing catch-up with recent Treasury market dynamics.
Source:TradingView
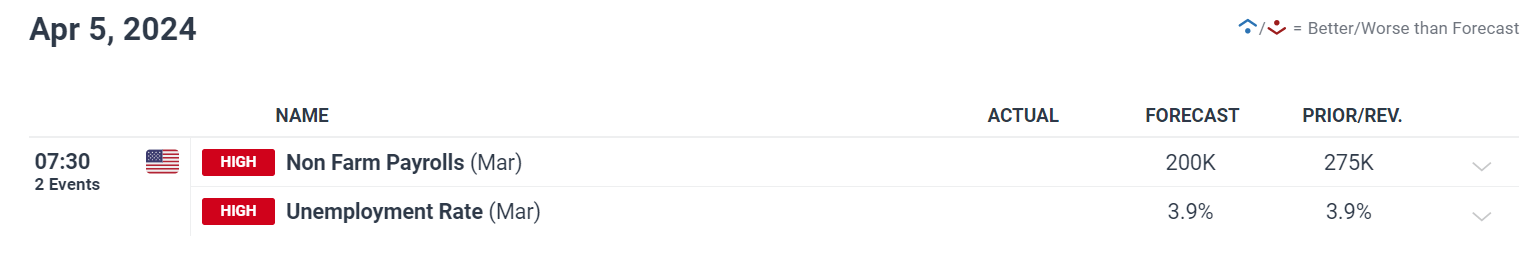
Casting our gaze towards the days ahead, there are several high-profile events on the U.S. economic calendar, but the most important will likely be the release of March nonfarm payrolls on Friday. This report, widely followed on Wall Street, will provide an updated view of the labor market and possibly guide the Federal Reserve’s next move in terms of monetary policy.
Consensus estimates suggests U.S. employers added 200,000 workers to their ranks last month, a figure anticipated to keep the jobless rate steady at 3.9%. However, given that job growth has consistently outperformed forecasts recently, traders should prepare for the the possibility of another upside surprise in the NFP headline print.
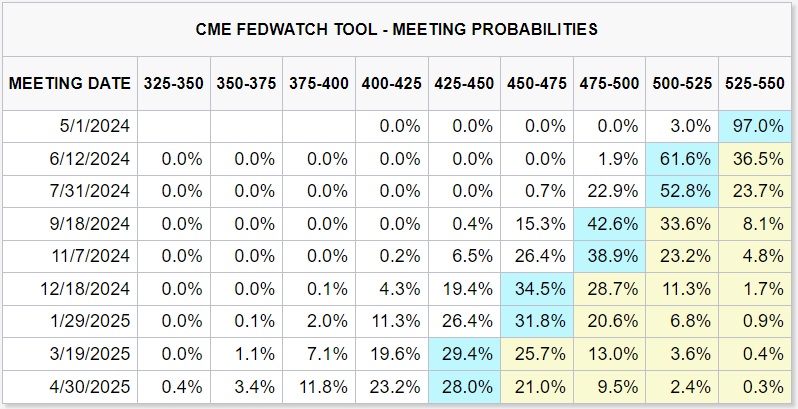
If hiring activity outpaces projections by a wide margin, traders are likely to temper bets of the Fed delivering 75 basis points of easing in 2024, further reducing the odds that the first rate cut of the cycle will arrive at the June FOMC meeting, which currently stands at 61.6%. This scenario could contribute to increased upward pressure on U.S. yields, boosting the U.S. dollar in the process.
Source: CME Group
On the other hand, a disappointing NFP report, particularly one marked by a notable deficit in job creation relative to what’s priced in, could strengthen the case for earlier Fed rate cuts. Such a turn of events could weigh on yields, paving the way for a bearish reversal in the U.S. dollar. A headline NFP reading near or below 100,000 could catalyze this response.
Want to know where the U.S. dollar is headed over the coming months? Explore all the insights available in our second-quarter forecast. Request your complimentary guide today!

EUR/USD FORECAST - TECHNICAL ANALYSIS
Following a sharp pullback in recent days, EUR/USD rebounded on Tuesday from a key support near 1.0725. Should this upward movement gain traction in the days ahead, resistance looms at 1.0800, followed by 1.0835, where the 50-day and 200-day simple moving averages converge.
On the contrary, if sellers regain control and push prices lower, the first critical support to watch is positioned at 1.0800. Bulls must vigorously protect this area to prevent sentiment towards the euro from deteriorating further; a failure to do so could spark a decline towards 1.0700 and 1.0640 thereafter.
EUR/USD PRICE ACTION CHART
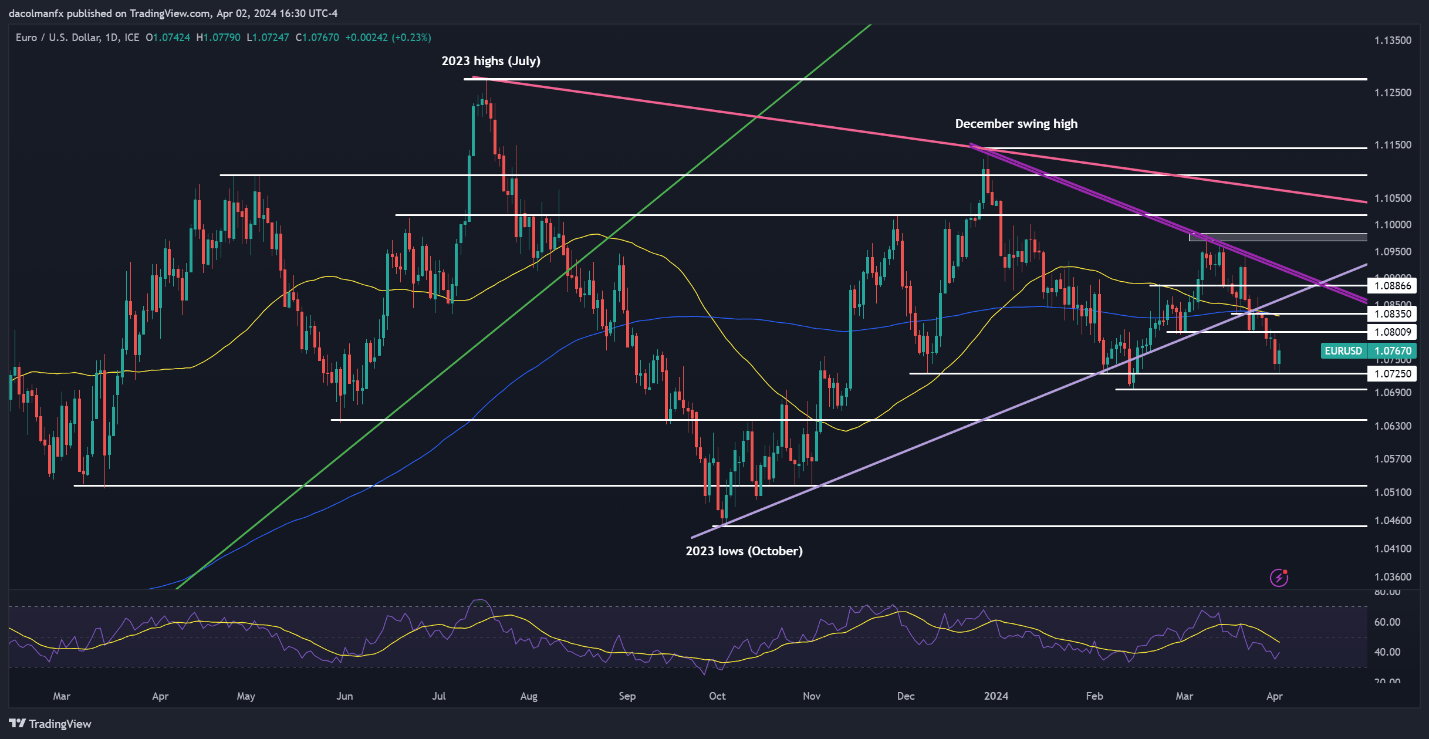
EUR/USD Chart Created Using TradingView
Wondering about the yen's prospects – will it continue to weaken or mount a bullish comeback? Discover all the details in our Q2 forecast. Don't miss out – request your complimentary guide today!

USD/JPY FORECAST - TECHNICAL ANALYSIS
USD/JPY traded within a confined range on Tuesday, hovering below overhead resistance at 152.00. This technical ceiling demands careful monitoring, as a breakout may trigger intervention from the Japanese government to prop up the yen. In such scenario, a swift reversal below 150.90 could ensue, followed by a slump towards the 50-day simple moving average at 149.75.
In the event that USD/JPY breaches the 152.00 mark and Tokyo refrains from intervening, choosing instead to let markets self-adjust, buyers may feel emboldened to initiate a bullish assault on 153.85, a key barrier created by an ascending trendline tracing back to December of the previous year.
USD/JPY PRICE ACTION CHART
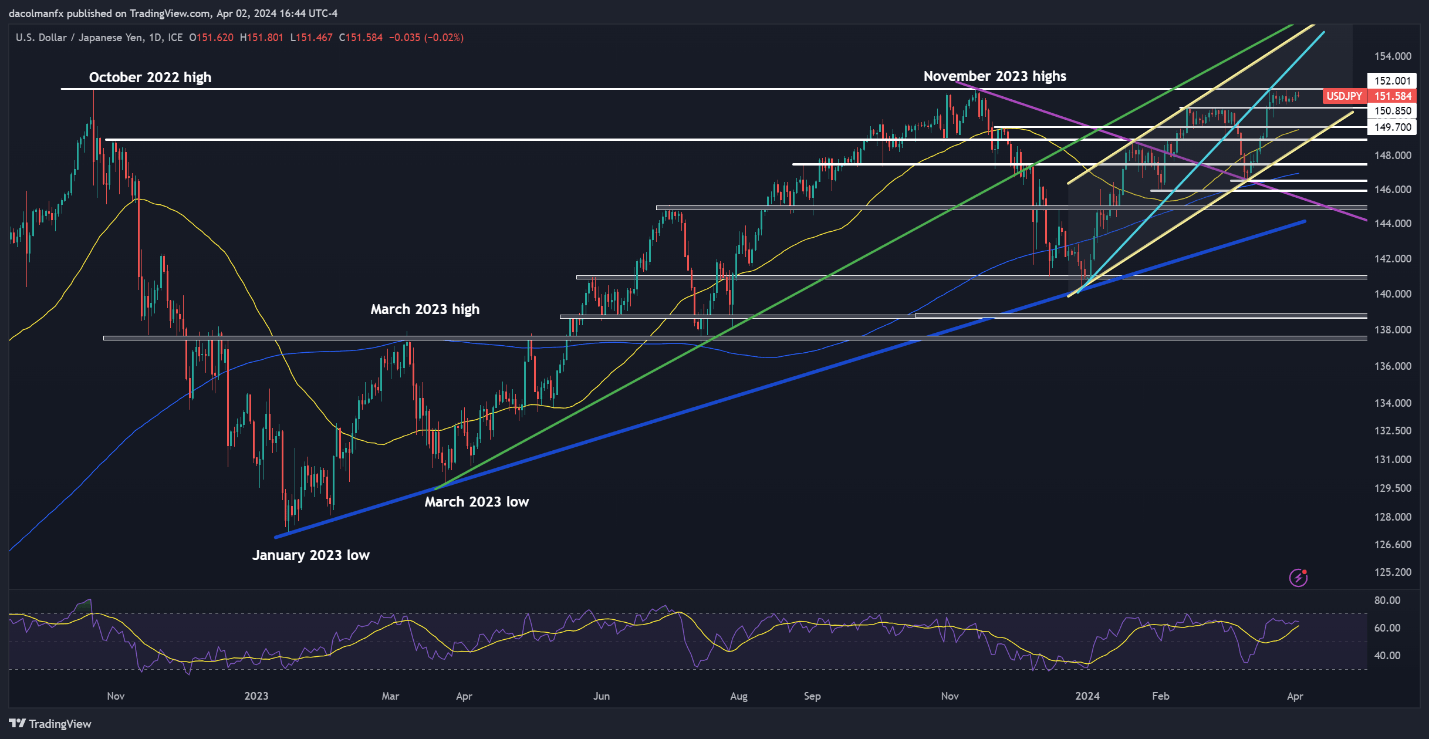
USD/JPY Chart Created Using TradingView
Curious to uncover the connection between FX retail positioning and USD/CAD’s price action dynamics? Check out our sentiment guide for key findings. Download it now!
| Change in | Longs | Shorts | OI |
| Daily | -2% | 7% | 5% |
| Weekly | -30% | 38% | 13% |
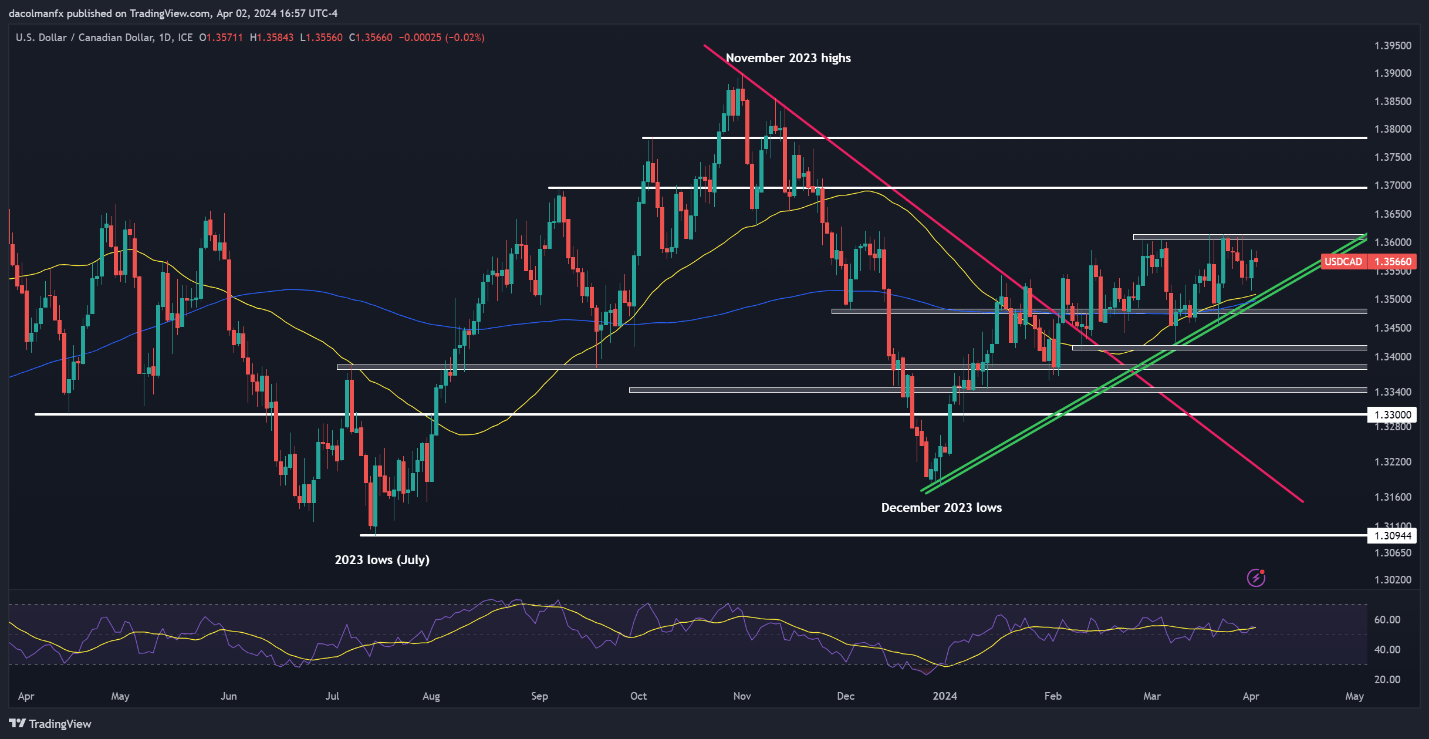
USD/CAD FORECAST - TECHNICAL ANALYSIS
USD/CAD remained steady on Tuesday, failing to extend its rebound from the prior session. Despite market indecisiveness, prices maintain their position above key moving averages and a trendline dating back to December, signaling a bullish outlook. With that in mind, if the pair resumes its upward bounce, horizontal resistance can be spotted at 1.3600. Beyond this point, attention will shift towards 1.3695.
On the other hand, if USD/CAD encounters a setback and changes direction downwards, technical support stretches from 1.3510 to 1.3495, followed by 1.3480. Continued losses beyond this juncture would draw focus to 1.3420.
USD/CAD PRICE ACTION CHART