
CANADIAN DOLLAR OUTLOOK:
- USD/CAD extends losses amid positive market sentiment
- Higher oil prices also benefit the Canadian dollar
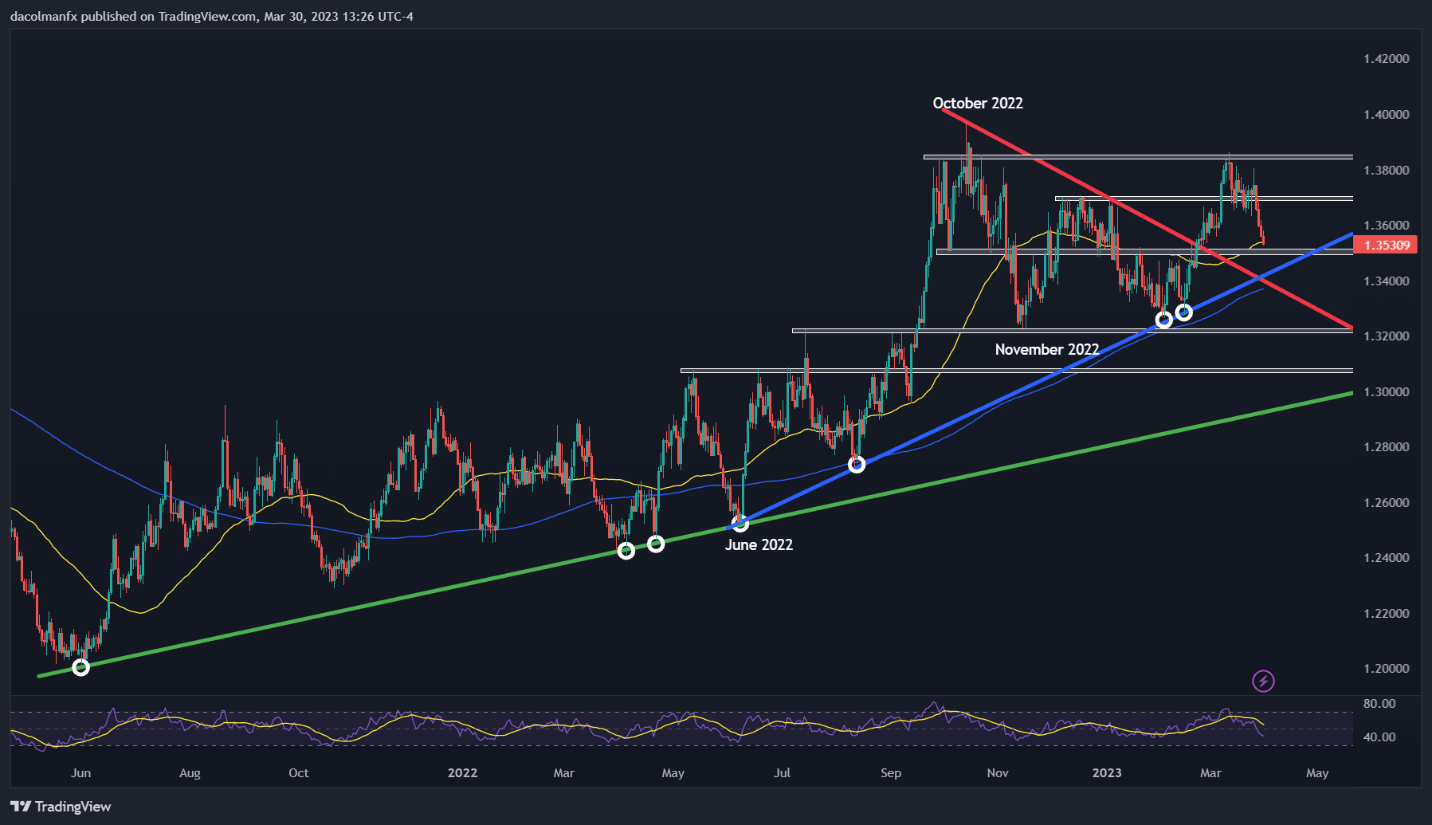
- The pair seems to be on the verge of invalidating a key technical support zone, a bearish signal for price action

Most Read: EUR/USD Confronts Trendline Resistance, Threatens Breakout After Hot German CPI
The Canadian dollar, colloquially known as the loonie by forex traders, continued to appreciate on Thursday, supported by widespread U.S. dollar weakness, risk-on sentiment on Wall Street and rising oil prices, with USD/CAD retreating more than 0.2% to 1.3530, the lowest exchange rate in a week.
After falling more than 2.4% from the 2023 highs reached on March 10, the pair is currently sitting above an important technical support zone located near the psychological 1.3500 level and the 50-day simple moving average, as seen on the daily chart below. Traders should keep a close eye on the pair's behavior in this area for clues on the near-term direction.
For bearish conviction to strengthen, USD/CAD must break below 1.3500 decisively on daily closing prices. With global market sentiment on the mend, this scenario could unfold in short order, paving the way for a drop towards trendline support at 1.3420. On further weakness, the focus shifts to the 200-day simple moving average, followed by 1.3220.
Conversely, if bulls manage to wrestle temporary control and drive prices higher, initial resistance can be seen at 1.3700, a barrier that has halted upside momentum in its tracks on numerous occasions in December 2022 and January this year. In the event of a bullish breakout, a retest of the March swing high cannot be ruled out.

USD/CAD TECHNICAL CHART