


U.S. DOLLAR ANALYSIS & TALKING POINTS
- US CPI data continues steady fall but persists far above the Fed’s inflation target.
- Fed interest rate expectations stay fixated on multiple rate cuts.
- Technical analysis on both US Treasuries and DXY pint to subsequent downside.

DOLLAR FUNDAMENTAL BACKDROP
US CPI (refer to economic calendar below) was released largely in line with expectations with the headline print marginally lower at 4.9%. No real surprises here and from a Fed perspective, a welcomed release. A CPI beat may have ‘hawkishly’ repriced Fed rate hike expectations after the strong US jobs report last week. Higher gasoline prices contributed to an elevated read leaving the inflation figure distanced from the target rate of 2%.
Foundational Trading Knowledge
Macro Fundamentals
Recommended by Warren Venketas
US ECONOMIC CALENDAR
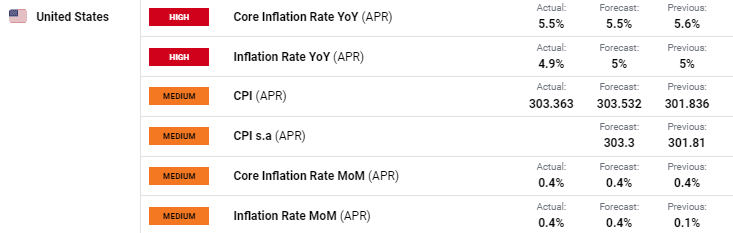
Source: DailyFX economic calendar
Implied Fed funds futures pricing for year end have increased almost 8bps post-announcement now anticipating 71bps of cumulative rate cuts. The immediate reaction by the USD as shown via the Dollar Index (DXY) saw bears jump back in and drive prices lower.
Trade Smarter - Sign up for the DailyFX Newsletter
Receive timely and compelling market commentary from the DailyFX team
FEDERAL RESERVE INTEREST RATE PROBABILITIES
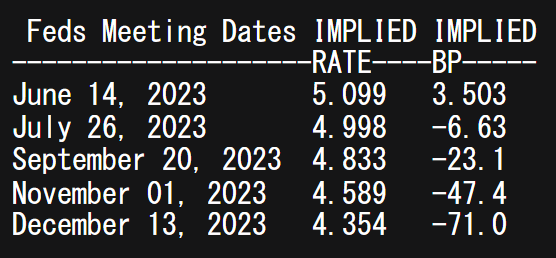
Source: Refinitiv
MARKET REACTION - TECHNICAL ANALYSIS
U.S. 10-YEAR TREASURY YIELD DAILY CHART
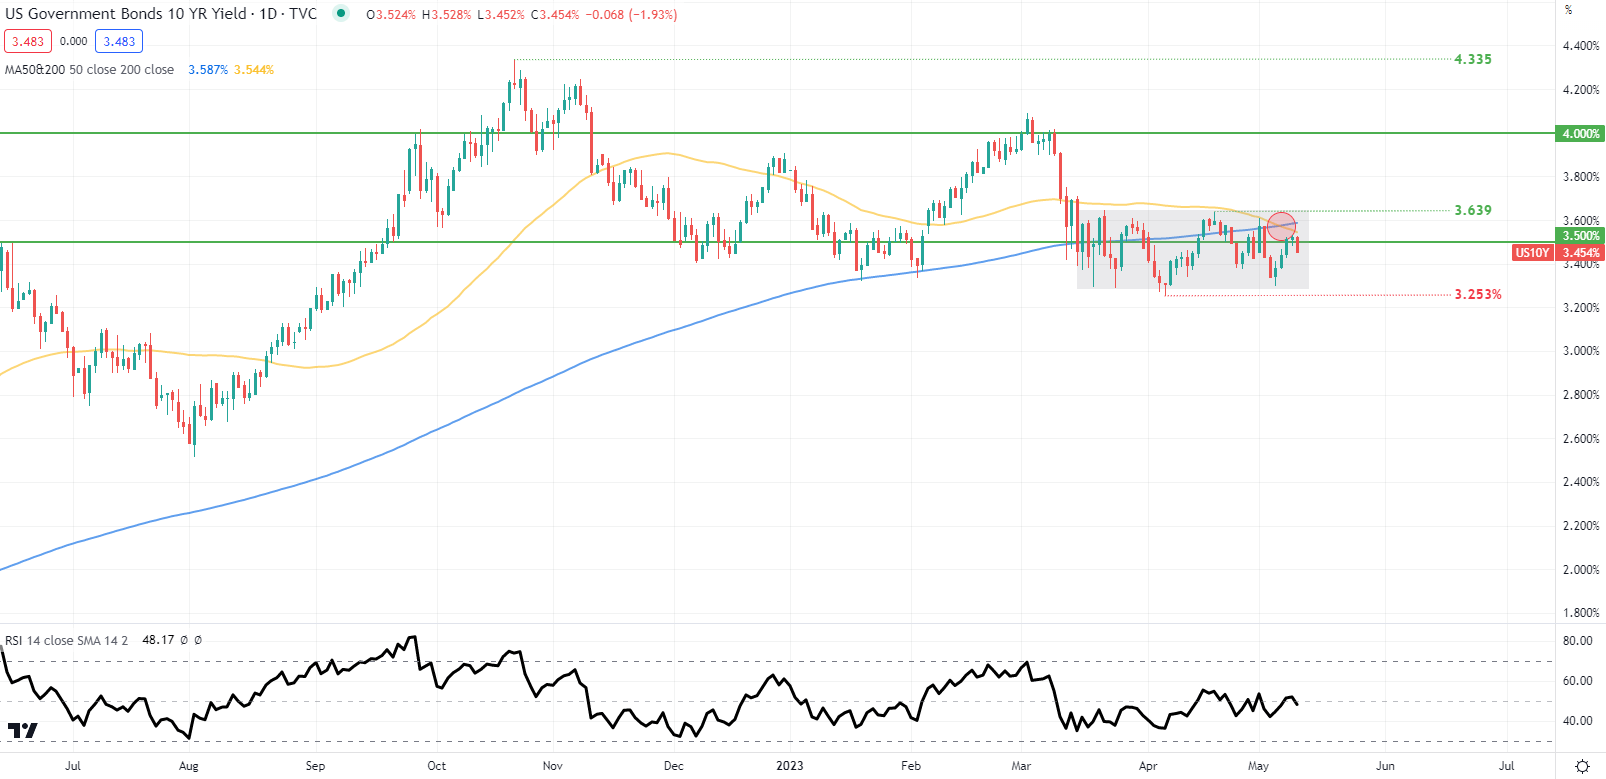
Chart prepared by Warren Venketas, IG
The U.S. 10-year Treasury yield consequently fell below the 3.5% mark in conjunction with the death cross (red) signal that may suggest yields are heading towards the 3.253% swing low.
U.S. DOLLAR INDEX DAILY CHART
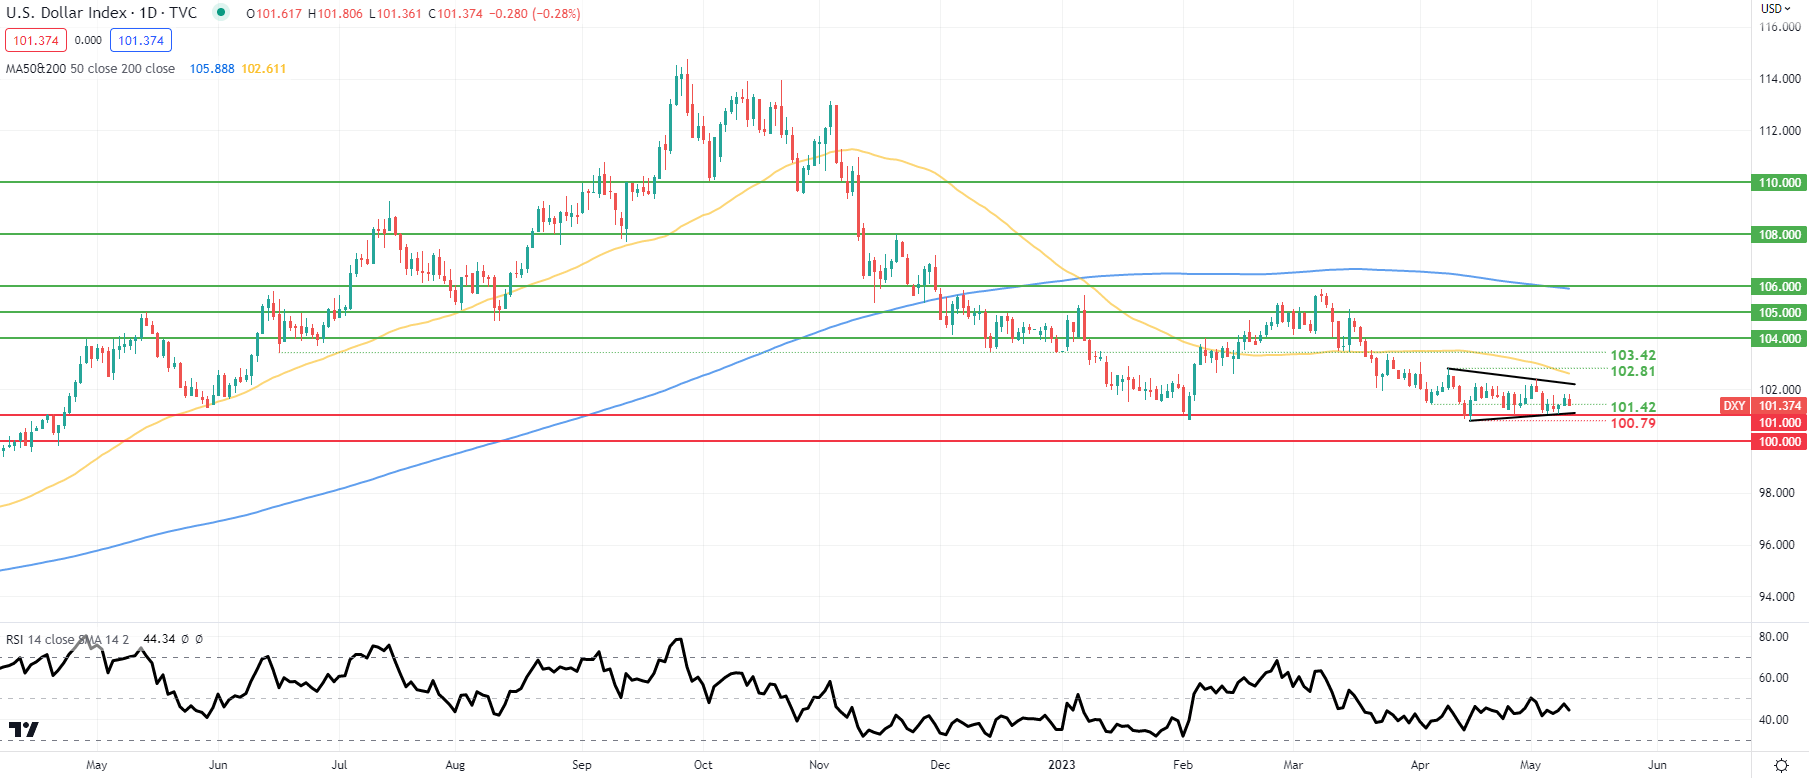
Chart prepared by Warren Venketas, IG
The daily DXY chart has pierced the 101.42 swing low heading towards symmetrical triangle support. A break below coinciding with the 101.00 psychological handle could subsequently expose the 100.00 level and beyond.
Resistance levels:
- 103.42
- 102.81
- 50-day MA (yellow)
- Triangle resistance
- 101.42
Support levels:
- Triangle support
- 101.00
- 100.79
- 100.00
--- Written byWarren Venketasfor DailyFX.com
Contact and followWarrenon Twitter:@WVenketas


