
US DOLLAR ANALYSIS AFTER US INFLATION
The U.S. dollar, as measured by the DXY index, advanced modestly on Wednesday following somewhat mixed U.S. inflation figures.
Headline CPI rose 0.6% on a seasonally adjusted basis in August, pushing the 12-month reading to 3.7% from 3.2% previously, one-tenth of a percent above consensus estimates. Meanwhile, the core gauge, which tends to reflect longer-term trends in the economy, climbed 0.6% monthly and 4.3% compared to the previous year, closely aligning with Wall Street’s projections in both instances.
US INFLATION DATA AT A GLANCE

Source: DailyFX Economic Calendar
Today's data had little impact on market pricing for the September FOMC conclave, with traders mostly anticipating no monetary policy action. Regarding the November meeting, the initial response in swaps suggested a greater chance of a quarter-point hike, but these odds decreased again as the day progressed, highlighting investor uncertainty.
Don’t let trading opportunities slip away. Download the U.S. dollar quarterly forecast for key insights and strategies!

FOMC MEETING PROBABILITIES
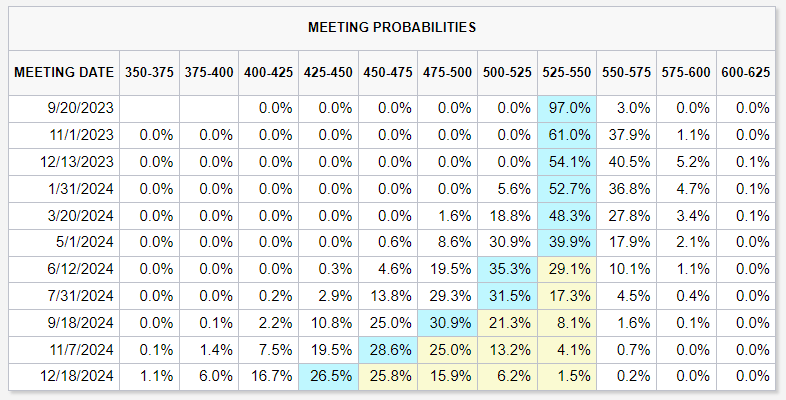
Source: FedWatch Tool – CME Group
With interest rate expectations in a state of flux and the Fed highly sensitive to new information, it is important to keep an eye on the economic calendar as incoming data may move the needle for policymakers and influence the path of monetary policy.
In this context, three pivotal reports—retail sales, wholesale inflation, and consumer sentiment—stand poised to offer invaluable insights into the broader U.S. economic landscape and establish the tone for the U.S. dollar against the British pound and the Aussie in the upcoming days. It is advisable for traders to keep a vigilant watch on these events.
Uncover expert strategies and useful tips. Download the “How to trade GBP/USD” to empower your trading!

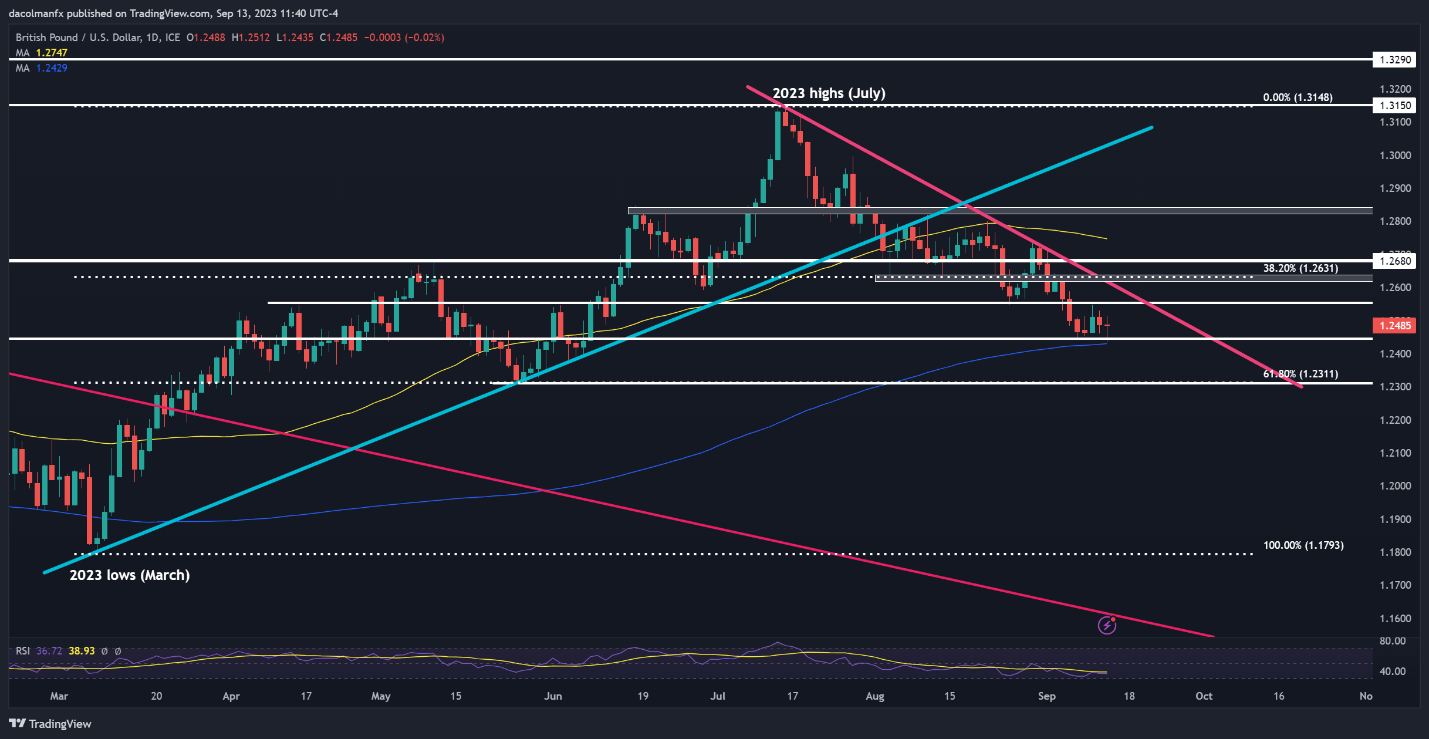
GBP/USD TECHNICAL ANALYSIS
GBP/USD has suffered heavy losses since mid-July but has held above its 200-day simple moving average around 1.2450, with the bulls defending this technical support tooth and nail so far, a sign that the worst may be over for sterling.
If the 200-day SMA holds in the coming days, it would be the clearest indication that the pair has bottomed out and that a recovery phase could soon begin. Under this scenario, we could see a move towards 1.2550, followed by a possible retest of trendline resistance near 1.2600. On further strength, the focus shifts to 1.2685.
On the flip side, if 1.2450 gives way, all bets are off. Such a breakdown could be a bad omen for the pound, reinforcing downside pressure and setting the stage for a pullback towards 1.2311, a key floor created by the 61.8% Fibonacci retracement of the March/July rally.
GBP/USD TECHNICAL CHART
GBP/USD Chart Prepared Using TradingView
Decode price action and stay ahead of AUD/USD trends. Download the sentiment guide to understand how positioning can offer clues about the market direction!
| Change in | Longs | Shorts | OI |
| Daily | -3% | 3% | 0% |
| Weekly | 4% | -5% | -1% |
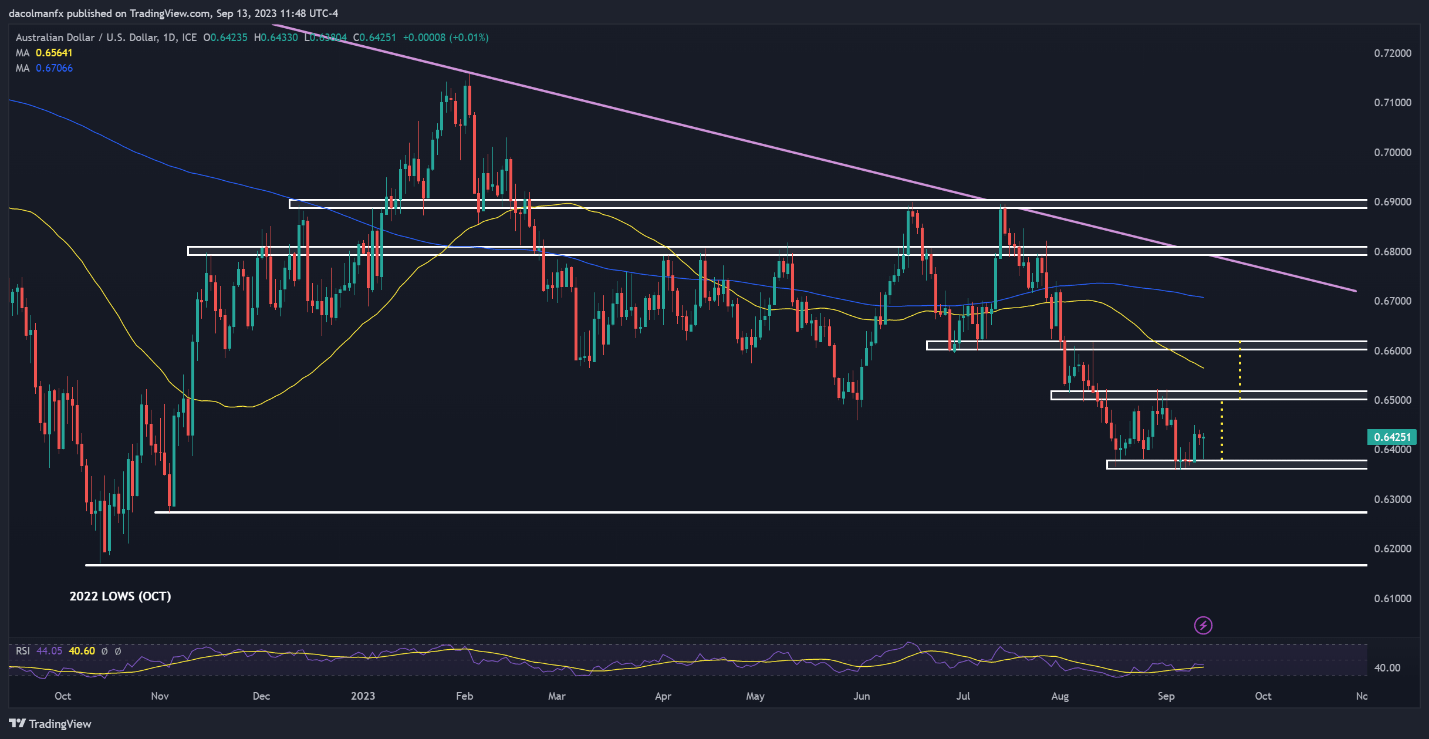
AUD/USD TECHNICAL ANALYSIS
The Australian dollar was choppy on Wednesday, oscillating between small gains and losses but lacking firm directional conviction. Despite the indecision, AUD/USD appears to be in the process of developing a double bottom, which usually tends to herald the exhaustion of downside pressure before a rebound.
To dig deeper into the particulars, a double bottom is a reversal technical formation consisting of two similar troughs separated by a crest in the middle. Confirmation of this bullish configuration occurs when prices complete the "W" shape and break above the neckline resistance defined by the intermediate peak.
To assess the potential extent of the price rise following the validation of the pattern, traders can project its height vertically from the breakout point. This estimate provides a practical approximation of the expected magnitude of the move, offering valuable guidance when considering trading strategies and risk management.
In the case of AUD/USD, the neckline resistance currently sits in the range of 0.6500 to 0.6510. If the pair can convincingly breach this barrier, buying momentum could gather pace, potentially opening the door for a climb beyond the psychological level of 0.6600.
Conversely, if sellers regain control of the market and spark a bearish turnaround, support can be found at 0.6360. A drop below this level would invalidate the double bottom, setting the stage for a decline towards 0.6275, followed by 0.6170 in the event of further weakness.
Master AUD/USD trading like a pro. Download the "How to Trade the Australian Dollar Guide" for expert insights and tips!
| Change in | Longs | Shorts | OI |
| Daily | -3% | 3% | 0% |
| Weekly | 4% | -5% | -1% |
AUD/USD TECHNICAL CHART