


US Dollar (DXY) Price and Chart Analysis
- Today’s data will set the tone for early next week.
- The US dollar is sitting on range support.

The US dollar continues this week’s range trading, helped in part by limited US data and the Fed blackout period ahead of next week’s FOMC decision. The dollar remains stuck in an old trading zone and is likely to remain there unless today’s US PPI data and Uni of Michigan sentiment release give the greenback reason to breakout. The PPI release will give the markets the latest look at wholesale price pressures – the change in price over time domestic producers receive for their output – while the University of Michigan Consumer Sentiment report will also show the median expected year-ahead inflation rate. Both have the ability to move the dial but with US CPI and the FOMC next week, expectations in today’s data will need to miss or beat by a margin to provoke a sustained range break.
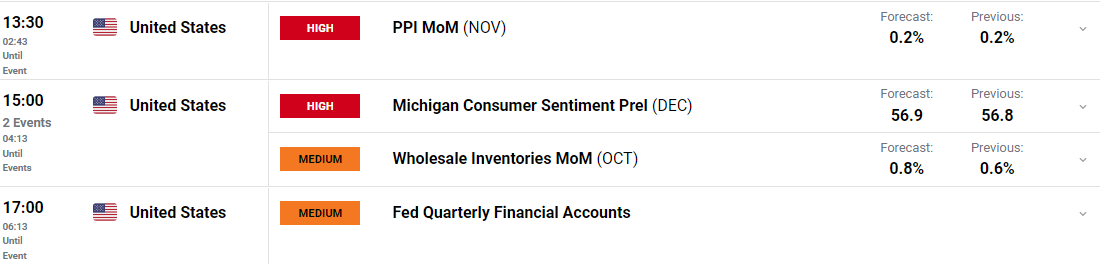
For all market-moving data releases and economic events see the real-time DailyFX Calendar.

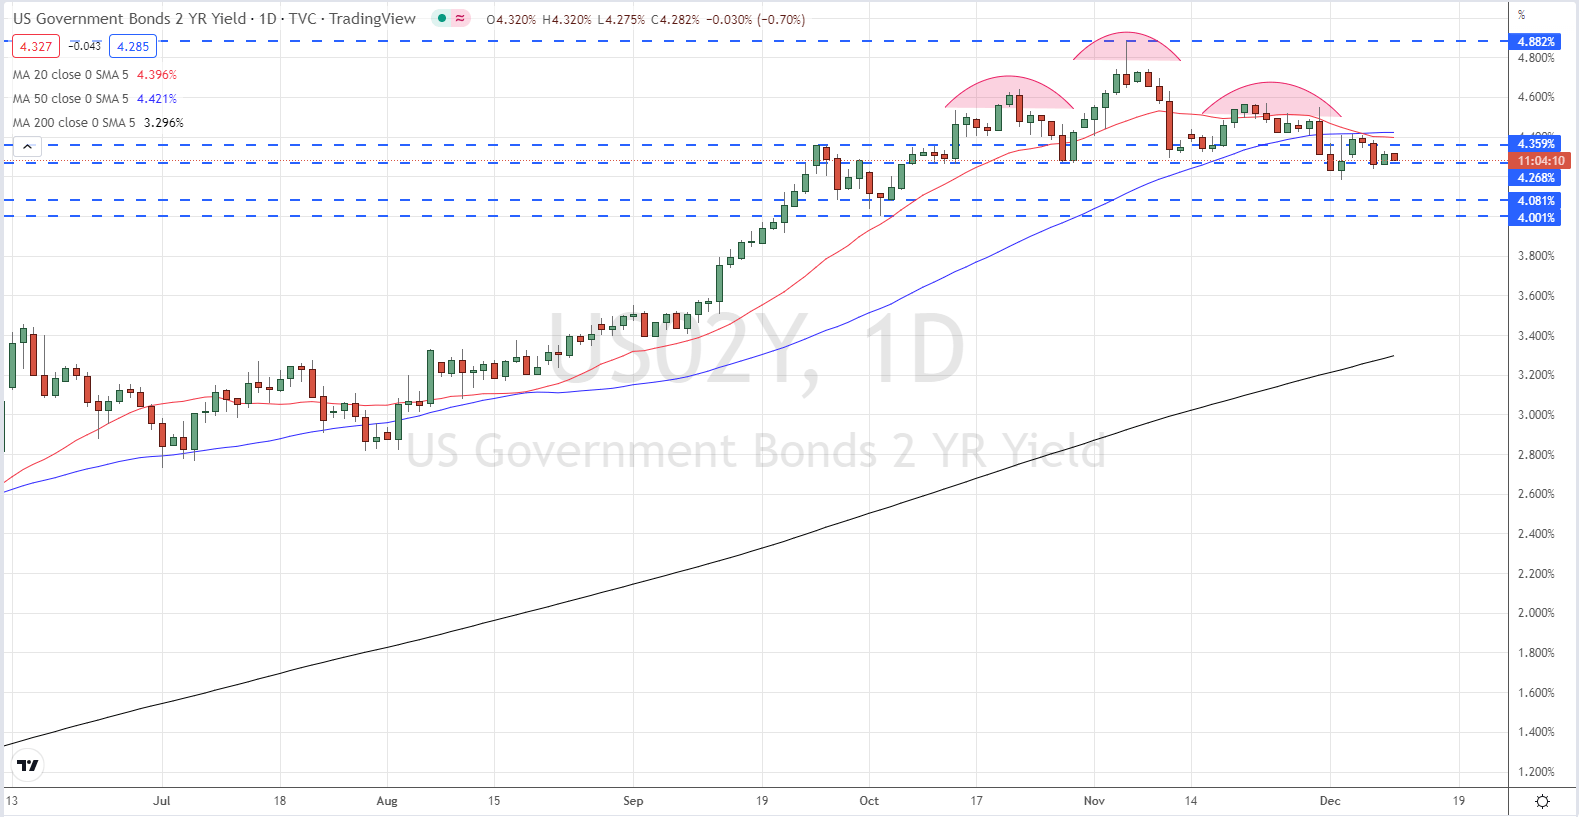
Short-dated US Treasury yields continue to probe support, and with the head and shoulders pattern continuing to play out, yields may go even lower. The next zone of support for the US 2-year is 4.00% - 4.08%. This zone is expected to hold in the short- to medium-term.
The Head and Shoulders Pattern: A Trader’s Guide
US 2-Year Treasury Yield Daily Chart – December 9, 2022
The US dollar remains on the backfoot after breaking, and opening, below the 200-day moving average this week. The 20-day ma is also on course to break below the longer-dated moving average, adding to negative sentiment, while prior support around 104.70 is being probed again. This level has been tested twice recently but not closed below. Releases and events next week have the ability to guide the greenback in the coming weeks, but today’s data should not be overlooked for a potential short-term move.
Important Single Candle Patterns
US Dollar (DXY) Daily Chart – December 9, 2022
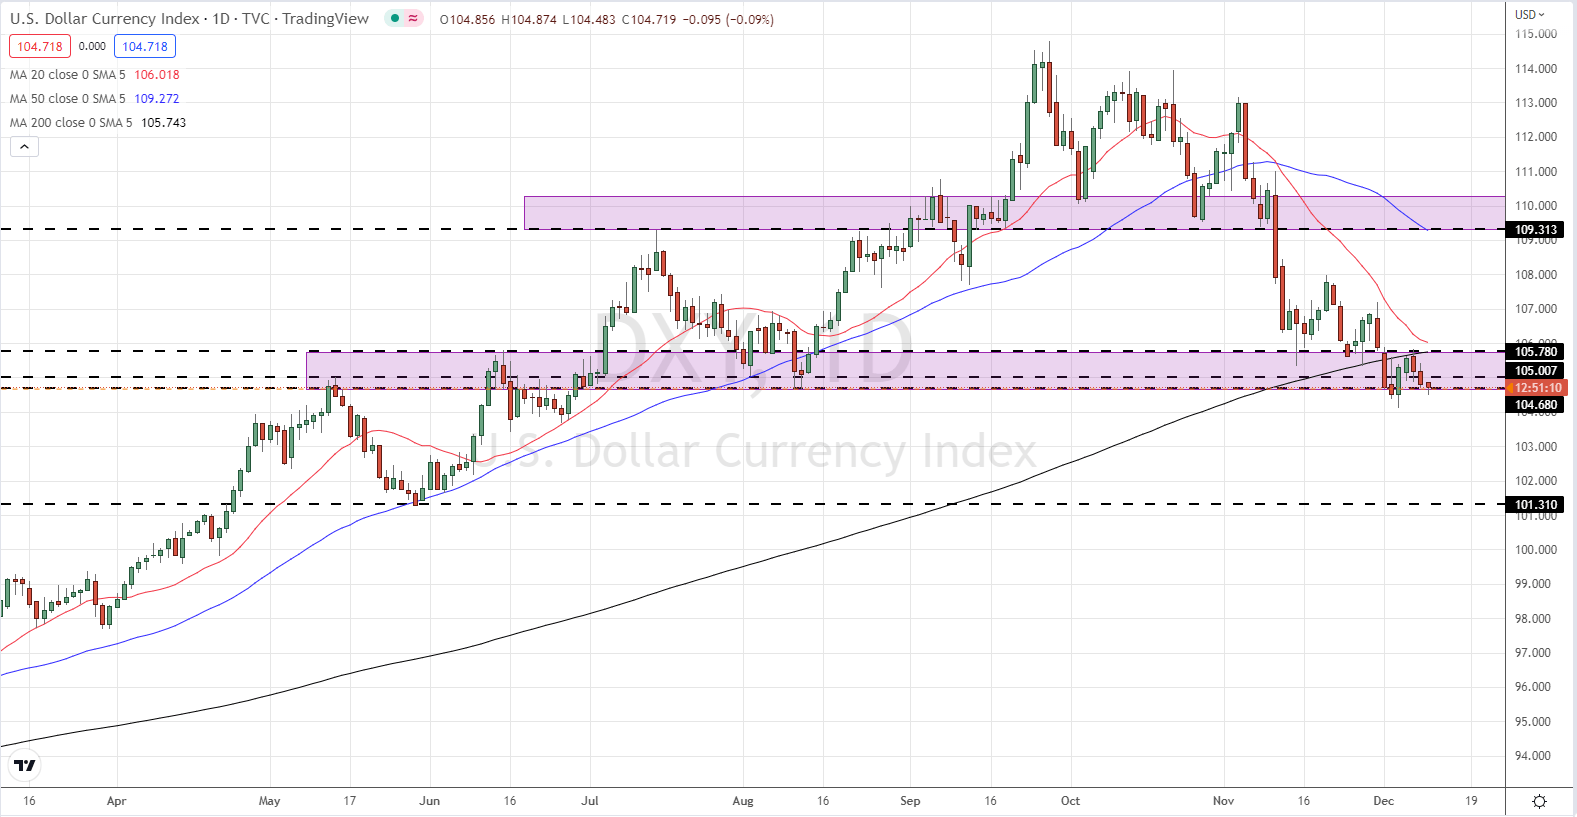
All Charts via TradingView
What is your view on the US Dollar – bullish or bearish?? You can let us know via the form at the end of this piece or you can contact the author via Twitter @nickcawley1.


