


US Dollar (DXY) Price and Chart Analysis
- ECB’s Lane pares back rate hike expectations.
- Short-dated US bond yields creep higher.
- Chinese covid-deaths spark concerns.

The US dollar basket (DXY) is pushing higher in early European trade, boosted by news of the first covid death in China for six months and supportive short-dated US Treasury yields. The dollar basket is also getting a push higher after comments from ECB board member Philip Lane suggested that a 75bp rate hike in December is becoming increasingly unlikely. In an interview with MNI, the ECB’s chief economist said that, ‘one platform for considering a very large rate hike, such as 75 basis points’ is no longer there’, while he added that ‘ the more we’ve already done, the less we need to do’. The sell-off in the Euro has pushed the US dollar basket higher nearly one point higher. The Euro accounts for 57.6% of the DXY weighting.
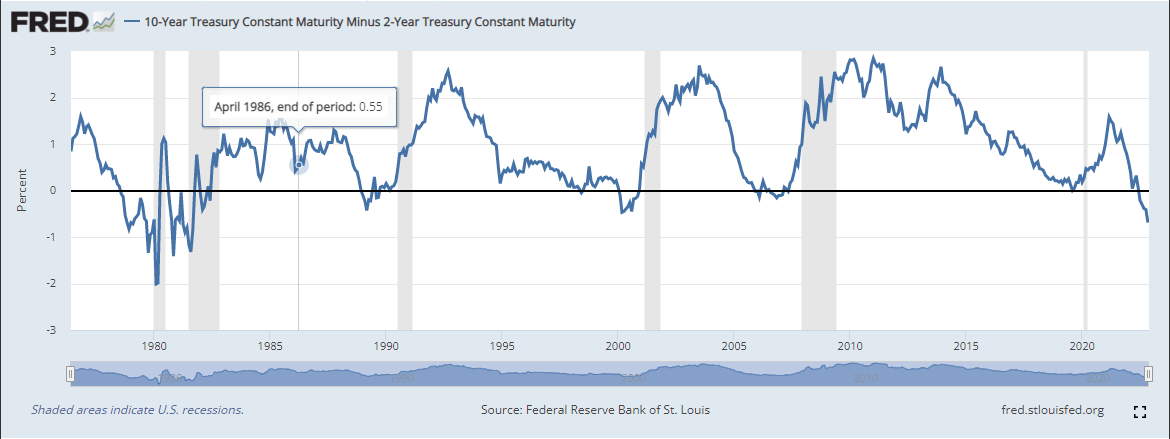
Short-dated US Bond yields continue to creep higher, supporting the US dollar along the way. The inversion between the UST 2s and 10s is now at 70bps, a worrying recessionary signal. If you go shorter, the UST 1-yr/10-year inversion is currently 95 basis points. The US bond market is clearly saying that rate cuts will be needed later next year.

China is battling a resurgence in Covid-19 cases, just days after relaxing some measures. According to Chinese Health authorities, 24k new cases were detected on Sunday.
EUR/USD Update: German PPI Surprise Fails to Arrest Slide as Risk-Off Mood Returns
For all market-moving data releases and economic events see the real-time DailyFX Calendar.
The US dollar index is pressing towards 108 after having traded at a multi-month low of 105.34 last Tuesday. The brief entry and exit into an old area of support kept the DXY away from the 200-day simple moving average (SMA), an indicator that has not been tagged since mid-June last year. The prior zone of resistance, starting at 109.31, should hold the current move, leaving the DXY in a trading zone for the next few days at least.
US Dollar Currency Index Daily Price Chart – November 21, 2022
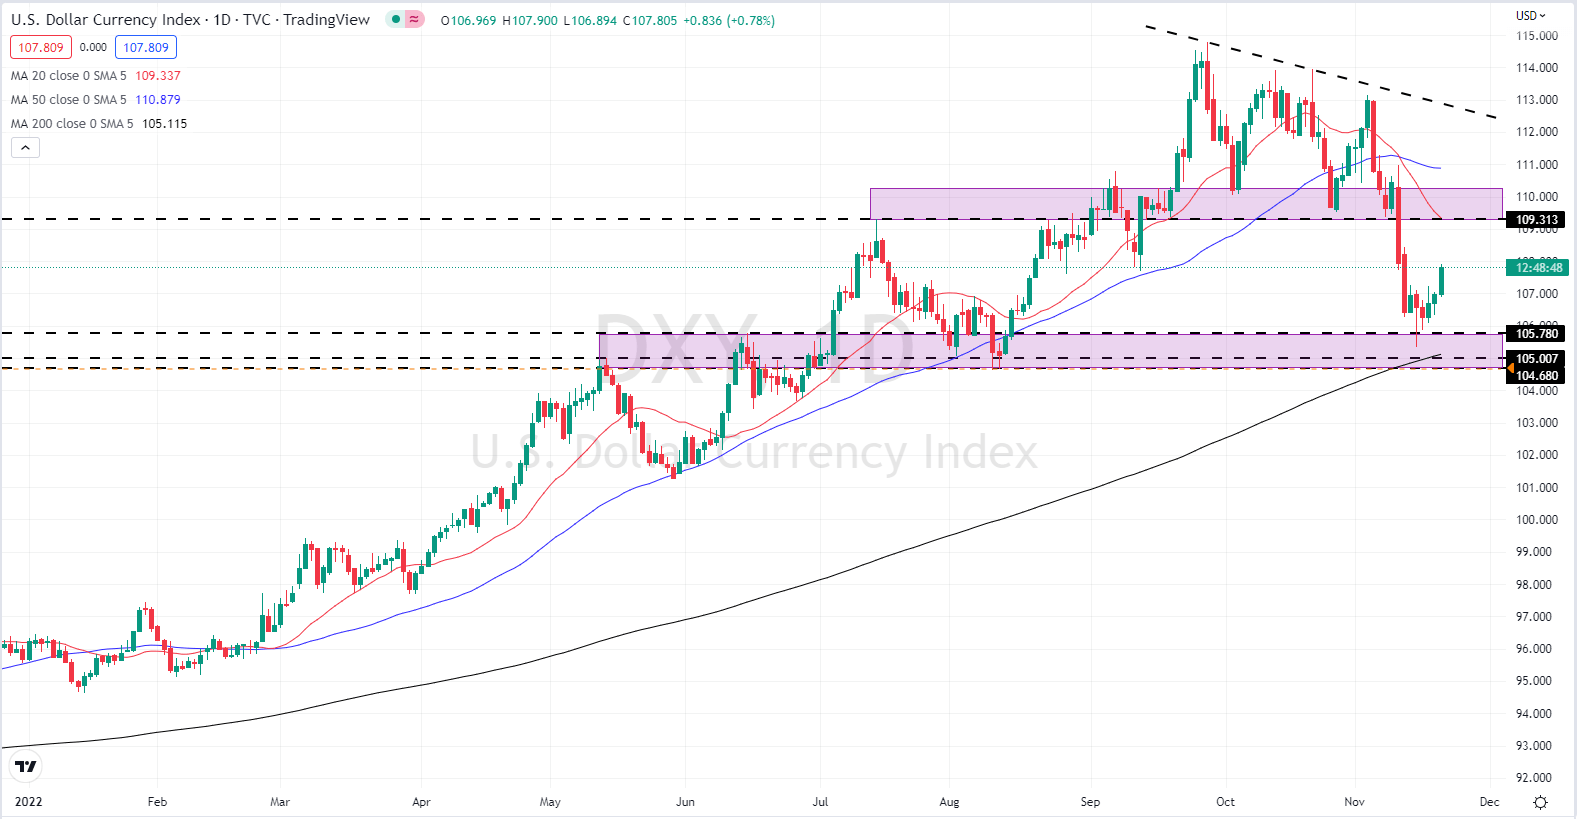
Chart via TradingView
What is your view on the US Dollar – bullish or bearish?? You can let us know via the form at the end of this piece or you can contact the author via Twitter @nickcawley1.


