


GOLD PRICE FORECAST:
- Gold (XAU/USD) Rallies Above $1900/oz as the 200-Day MA Comes io Focus.
- Dollar Index (DXY) Looks Ripe for a Drop but Fundamental Factors Could Keep the US Dollar Supported in the Interim.
- IG Client Sentiment Shows that Retail Traders are Overwhelmingly Long on Gold. Given the Contrarian View to Crowd Sentiment Adopted Here at DailyFX, is Further Downside Ahead?
- To Learn More About Price Action, Chart Patterns and Moving Averages, Check out the DailyFX Education Section.
The Top Trade Opportunities Identified by the DailyFX is Free to Download Below

MOST READ: Oil Price Forecast: WTI and Brent Slide as Overall Sentiment Flounders
Gold prices made a welcome return to the $1900 mark in early European trade thanks to weaker US Dollar Index and US Treasury Yields. The US 10Y hit levels last seen in 2007 yesterday but the Dollar has been unable to capitalize as technical factors and Jackson Hole weigh on the Greenback.
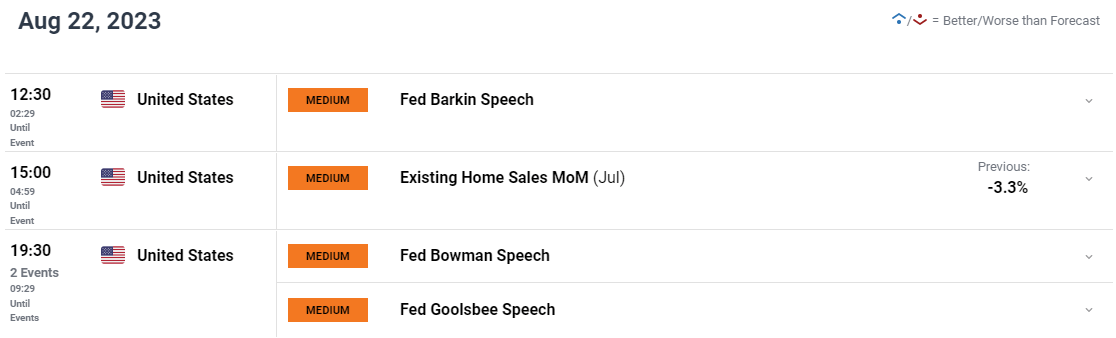
US DATA, FEDSPEK AND JACKSON HOLE AHEAD
As Gold looks to snap its recent run of losses market sentiment continues to whipsaw between risk-on and risk-off as China continues to play a role. Yesterday's gains on wall street have seen a slight improvement in sentiment coupled with the moderate rate cut in China.
Looking to the rest of the day and we do have a host of Fed policymakers on the docket in the absence of high-tier data. Given the absence of data we could see some volatility depending on the tone of Fed policymakers as we have not heard from many of them since the release of the FOMC minutes last week. There has been growing chatter around the potential for the Federal Reserve to keep rates higher for longer even if the hiking cycle is ‘done’. Given this narrative and higher US yields any downside on the US Dollar at this stage may be limited ahead of the Jackson Hole Symposium.
Market participants will be keeping a close eye on the US banking sector as well following a downgrade by S&P Global on multiple US Banks. The ratings agency cited tough operating conditions as weaker profits and funding risks will test the sector’s credit strength. Any further deterioration here could have a negative impact on sentiment, however as things stand and following the reaction to Moody’s downgrade, we could also see a relatively muted response. It is also worth noting that over the past few days we are seeing a change in sentiment during the US session to a more risk-on tone while the European and Asian sessions have leaned more toward risk-off. There may be opportunities should such a trend continue.
For Free Tips on How to Trade Gold, Get Your Guide Below

Dollar Index (DXY) Daily Chart – August 22, 2023
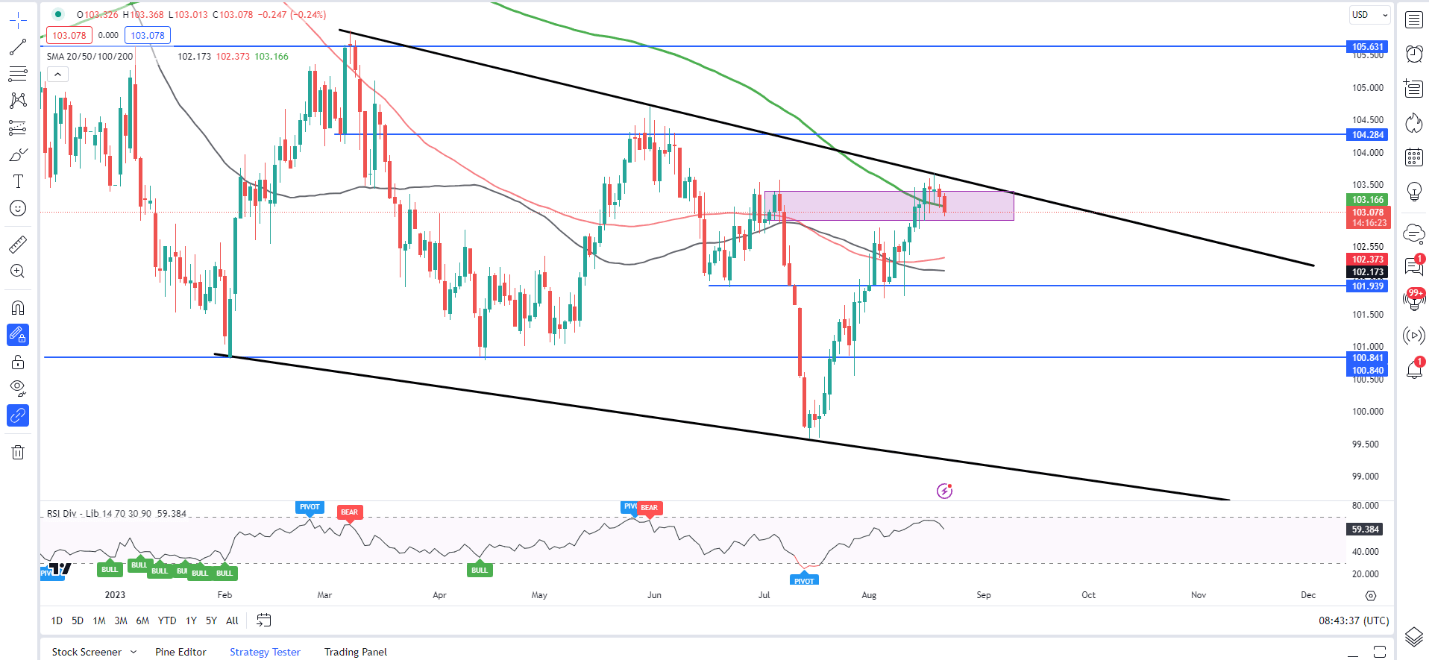
Source: TradingView, Chart Prepared by Zain Vawda
Jackson Hole Starts on Thursday and is likely to be the main driving force for markets this week. Central Bankers from the Bank of England (BoE), Bank of Japan (BoJ), European Central Bank (ECB) and of course Federal Reserve Chair Jerome Powell all expected to speak. As I have said over the past couple of days, I do not expect fireworks as we had at last year's event given the market dynamics at present. Volatility around the event is most likely guaranteed.
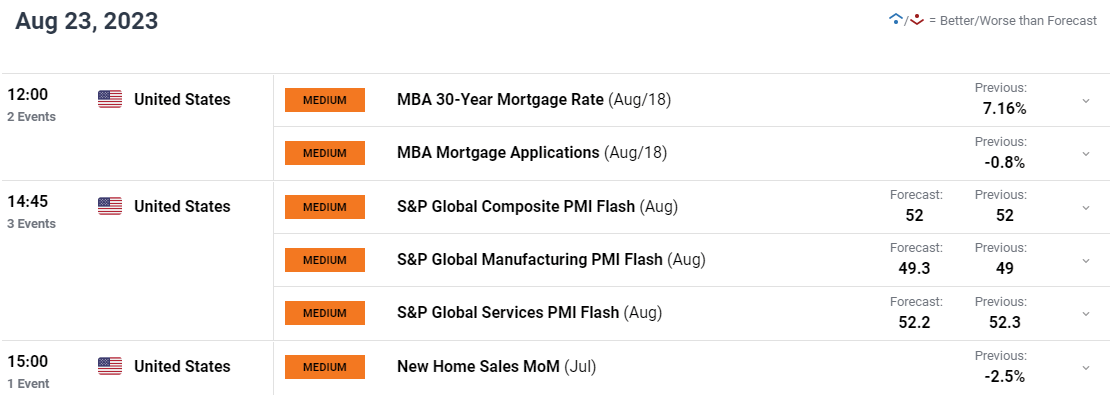
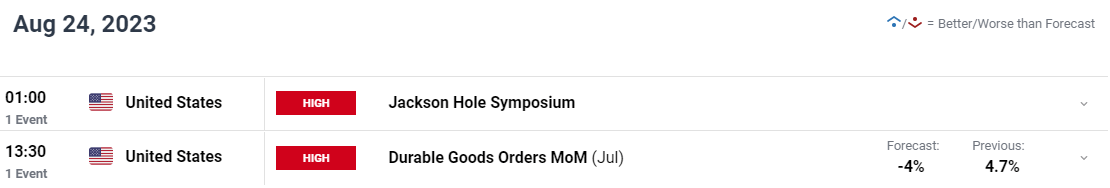
For all market-moving economic releases and events, see the DailyFX Calendar
TECHNICAL OUTLOOK AND FINAL THOUGHTS
Form a technical perspective, Gold prices have closed below the 200-day MA on a daily timeframe for the first time since December 2022. This is a strong indication that the longer-term trend may be shifting as gold loses its shine with attractive yields also weighing on the precious metal.
The rally which started yesterday occurred just as Gold prices reached overbought territory (RSI 14) while we also printed a double bottom on the four-hour timeframe hinting at further upside. Falling yields and a weaker dollar will be needed if we are to see the rally continue with the 200-day MA resting around the $1907 handle and could serve to cap gains. A rally beyond the 200-day MA needs to find acceptance above the resistance are between the $1925-$1930 handles for me to be convinced that the bulls are firmly in control once more.
Meanwhile, a rejection from the psychological $1900 mark and a retest of the recent lows around $1885 comes into focus. The 50-day MA rests around the $1867 which is just above the 78.6% fib retracement level of the 2023 low to high move and could be a key confluence area if reached.
Markets do appear to be largely driven by the fundamental and macro pictures at the moment and thus my initial thoughts are that any move will likely be dependent on the risk tone today as well as how market participants perceive the comments from Central Bankers at Jackson Hole later this week.
Gold (XAU/USD) Daily Chart – August 22, 2023
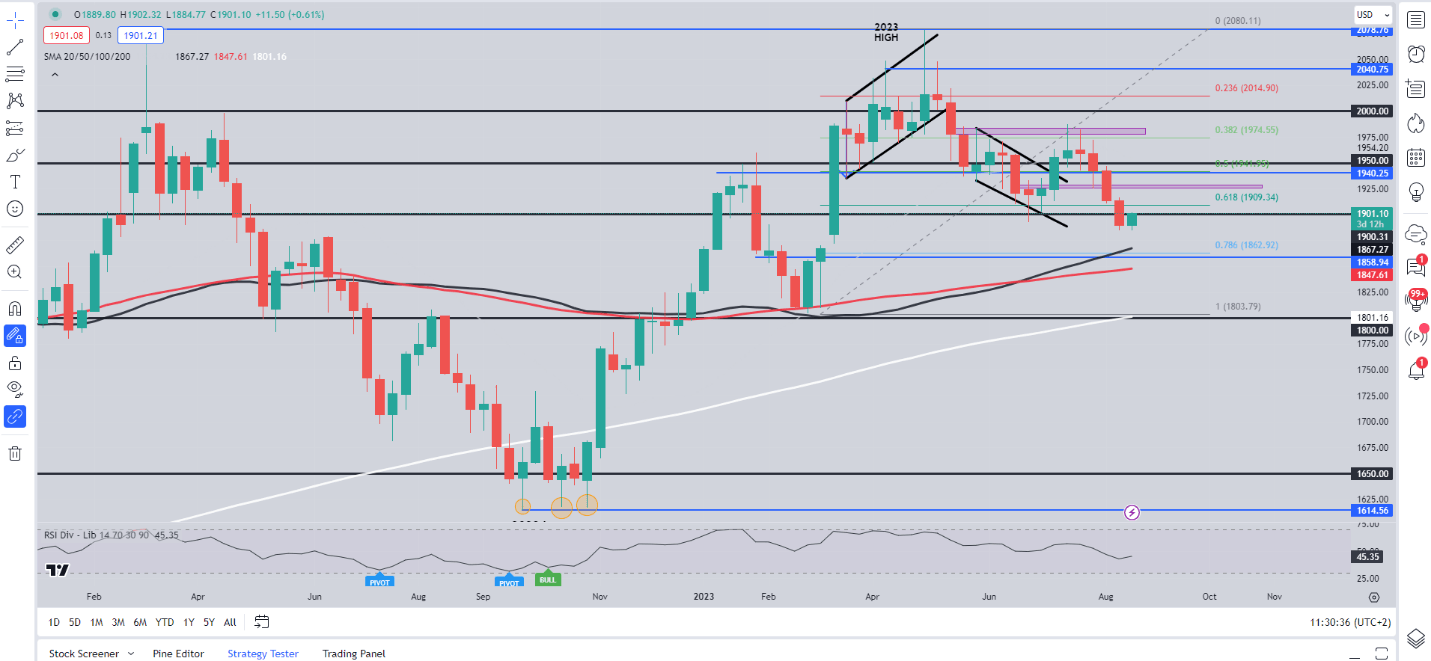
Source: TradingView, Chart Prepared by Zain Vawda
Taking a quick look at the IG Client Sentiment, retail trader data shows 79% of traders are net-long on Gold.
For a more in-depth look at GOLD client sentiment and changes in long and short positioning download the free guide below.
| Change in | Longs | Shorts | OI |
| Daily | -5% | 8% | 0% |
| Weekly | 4% | 10% | 7% |
Written by: Zain Vawda, Markets Writer for DailyFX.com
Contact and follow Zain on Twitter: @zvawda


