


XAU/USD PRICE FORECAST:
- Gold (XAU/USD) Bulls Remain Cautious Following Sticky US CPI. Retest of Recent Lows Grow More Appealing.
- The Technicals on Gold Remain Conflicted. A Golden Cross Pattern Printed in the Asian Session and a Death Cross Pattern Forming Just Another Sign of the Current Indecision at Play.
- IG Client Sentiment Shows that Retail Traders are Overwhelmingly Long on Gold Which Could Hint at Further Downside Ahead.
- To Learn More About Price Action, Chart Patterns and Moving Averages, Check out the DailyFX Education Section.
MOST READ: US Headline Inflation Nudges Higher, the US Dollar Remains Nonchalant

Gold prices spiked to a daily low following the US CPI print before regaining some composure to trade around $1911 at the time of writing. The precious metal has struggled for large parts of this week as expectations of higher rates for longer continue to weigh on prices.
US INFLATION AND FED RATE HIKE PROBABILITIES
US CPI showed signs of stickiness today as the headline figure beat estimates and increased by 0.4% MoM. The clarity that market participants had been hoping for has failed to materialize with today's CPI print likely to stir up more conversations on the Federal Reserve's next move. This has also largely kept the Greenback supported as markets adopt a more risk averse tone given the growing uncertainties both in Europe and the US.
Based on the CME data in the table below market participants seem assured of a Fed pause at next week's meeting. The current probability resting at 97%. The November meeting however looks more interesting and despite the sticky US CPI print markets are pricing in a 57% chance of a hold in November. This has increased ever so slightly from yesterday’s 55% while the Feds December meeting showing similar numbers.
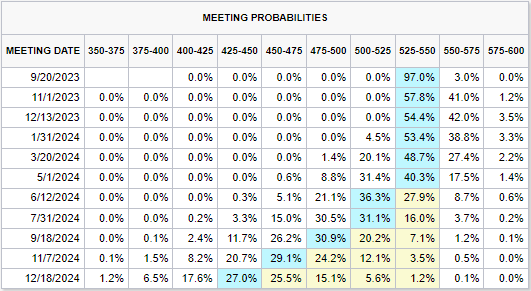
Source: CME FedWatch Tool
The US economy has remained resilient in 2023 but is likely to come in for sterner tests in Q4 as consumer savings continues to deteriorate. This coupled with an end to the student loan repayment freeze at the end of September could have a negative impact on both growth and consumption in Q4 and could factor into the Fed decision next week.
Introduction to Technical Analysis
Moving Averages
Recommended by Zain Vawda
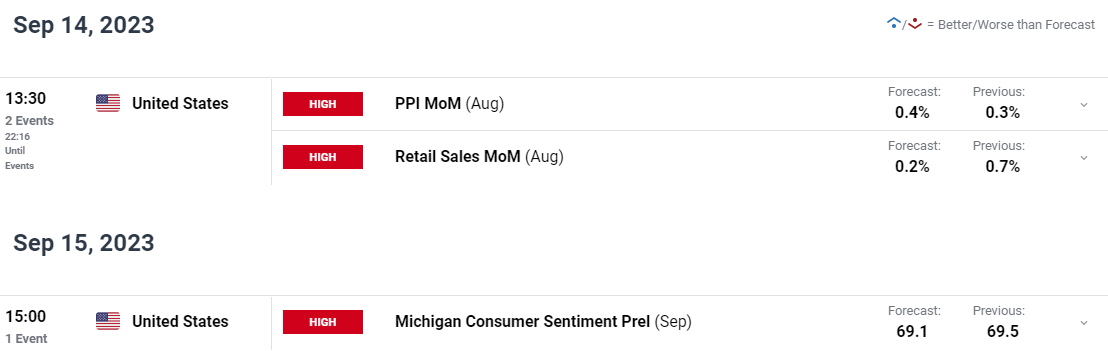
RISK EVENTS
We do have quite a bit of US data ahead this week but none of the events ahead are expected to make a major splash. The only thing that could change the narrative would be a massive beat of forecasts of the remaining data due which could see some hawkish repricing of the rate hike probabilities and in turn add further impetus for US Dollar bulls.
For all market-moving economic releases and events, see the DailyFX Calendar
GOLD TECHNICAL OUTLOOK
Form a technical perspective, Gold prices pierced through the 200-day MA yesterday and pushing further down toward the psychological $1900 level today. The 14-day RSI is also trading below the 50-mark pointing toward further downside ahead while the technicals on the four-hour chart providing mixed signals. This isn't surprising given the uncertainty around the US Dollar as well which has been a driving force for Gold prices of late.
Gold (XAU/USD) Daily Chart – September 13, 2023
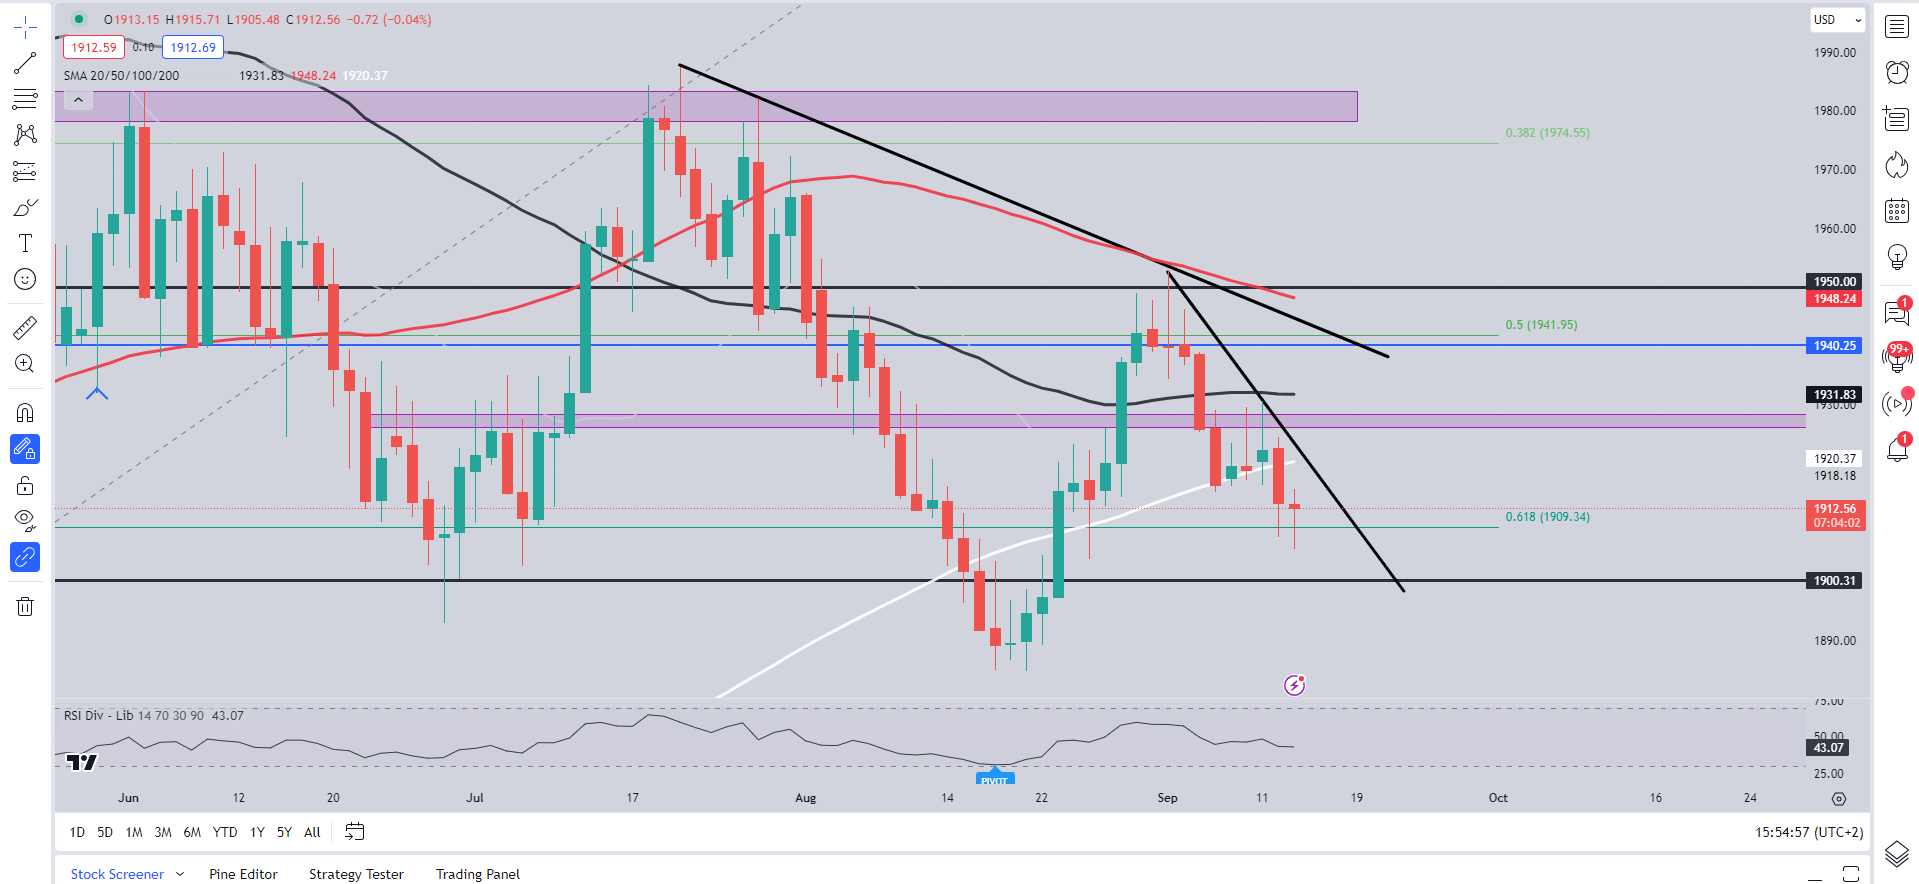
Source: TradingView, Chart Prepared by Zain Vawda
As mentioned above the Four-Hour chart below is providing mixed signals with a golden cross pattern in the Asian session while a death cross appears to be nearing completion as well. Looking at the bigger picture and i do see the potential for further downside in Gold prices but given that we just printed a fresh lower low there is a chance of a retracement toward the inner trendline which coincides with the 50, 100 and 200-day MAs around the $1923-$1925 handle. This would also provide potential shorts with the best risk to reward opportunity should a push below the $1900 mark come to fruition.
Gold (XAU/USD) H4 Chart – September 13, 2023
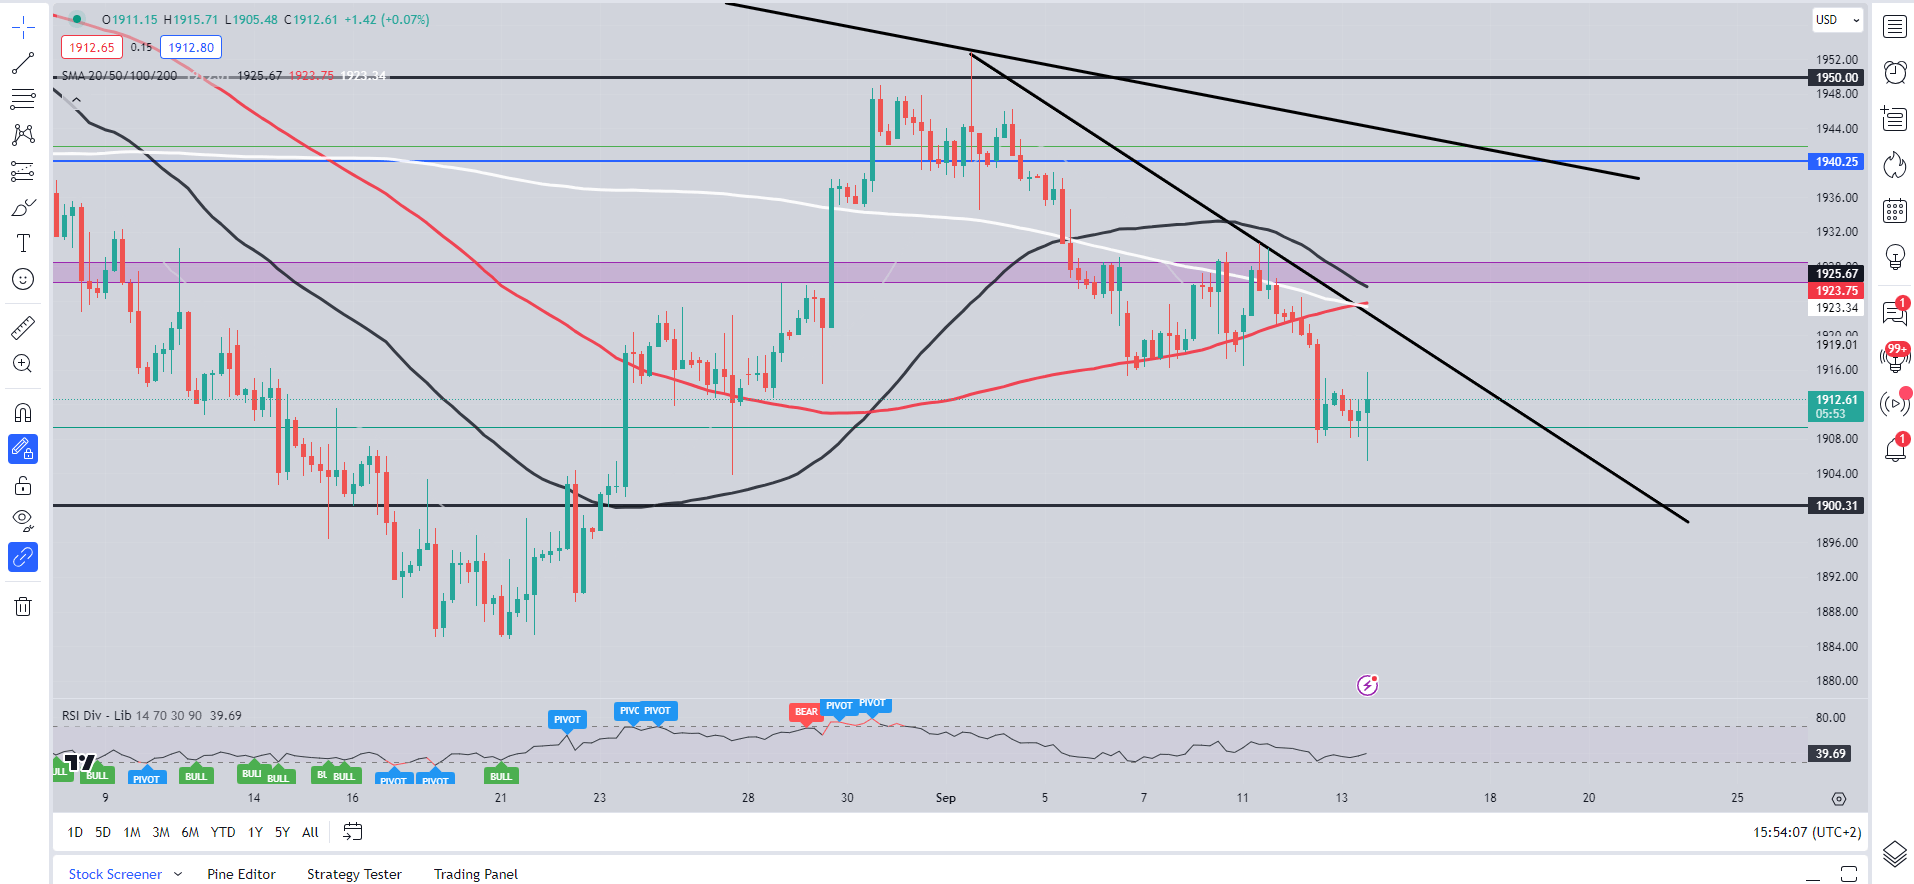
Source: TradingView, Chart Prepared by Zain Vawda
IG CLIENT SENTIMENT
Taking a quick look at the IG Client Sentiment, Retail Traders are overwhelmingly Long on Gold with 74% of retail traders currently Net-Long on the precious metal. Given the Contrarian View to Crowd Sentiment Adopted Here at DailyFX, is this a sign that Gold may fall further?
For a more in-depth look at GOLD client sentiment and changes in long and short positioning download the free guide below.
| Change in | Longs | Shorts | OI |
| Daily | -9% | 4% | -3% |
| Weekly | -11% | 18% | 1% |
Written by: Zain Vawda, Markets Writer for DailyFX.com
Contact and follow Zain on Twitter: @zvawda


