


GBP/USD - Prices, Charts, and Analysis

Most Read: British Pound Latest: GBP/USD Treads Water as US Data Deluge Nears
The move higher in GBP/USD continues apace with the pair now nearly 18% higher since its late-September nadir. The pair have just touched levels last seen over three months ago and from a technical point of view may press higher.
Yesterday’s speech by Fed chair Jerome Powell is the latest driver behind cable’s move higher with the greenback selling-off after the head of the central bank suggested that the next rate hike would be 50bps and not 75bps. The Fed has hiked rates by 75bps at the last four FOMC meetings.
While the macro backdrop is positive for GBP/USD, there are a couple of high-importance US data releases – Core PCE today at 13:30 GMT and NFPs tomorrow at 13:30 GMT – that may derail the move, in the short-term at least. On the flip side, if either release furthers the view that the Fed may be getting a tentative hold on the economy, further upside will be seen.
For all market-moving data releases and economic events see the DailyFX Calendar.

A Complete Guide to Using Moving Averages in Your Trading Strategy
After forming and playing out a textbook bullish pennant formation, cable is now testing an important long-term technical indicator, the 200-day moving average. Cable has been below this indicator since August last year, apart from a couple of failed breaks, and a confirmed move above the 200-dma would give the pair a positive boost. The next level of resistance is the August 1 high at 1.2292.
GBP/USD Daily Price Chart – December 1, 2022
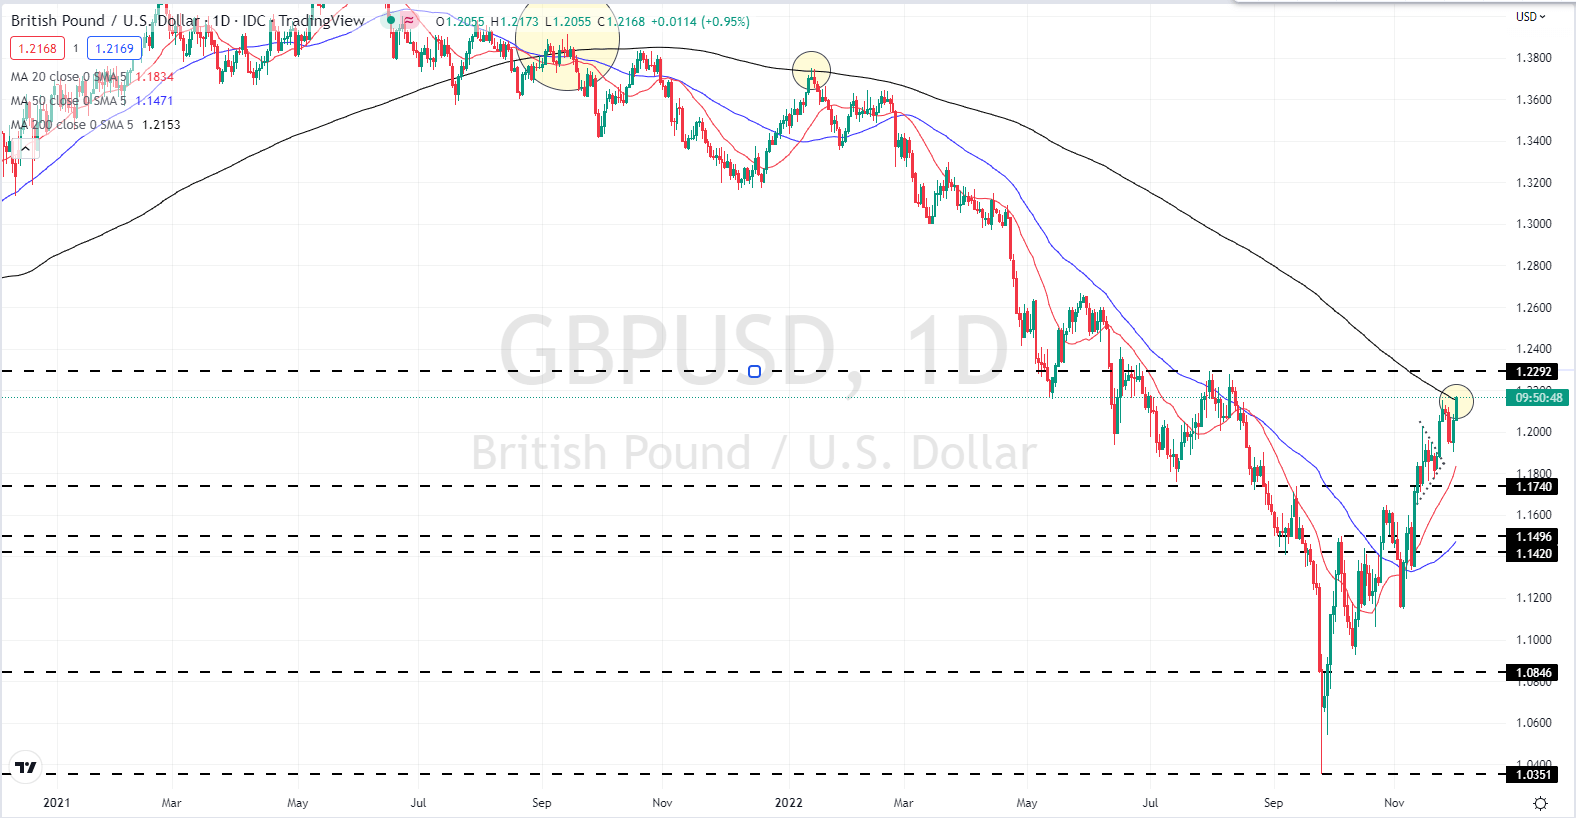
Chart via TradingView
Retail Traders Unsure
{{SENTIMENT|GBPUSD}}
Retail trader data show 43.27% of traders are net-long with the ratio of traders short to long at 1.31 to 1.The number of traders net-long is 11.69% lower than yesterday and 9.02% higher from last week, while the number of traders net-short is 1.69% higher than yesterday and 15.13% lower from last week.
We typically take a contrarian view to crowd sentiment, and the fact traders are net-short suggests GBP/USD prices may continue to rise. Positioning is more net-short than yesterday but less net-short from last week. The combination of current sentiment and recent changes gives us a further mixed GBP/USD trading bias.
What is your view on the British Pound – bullish or bearish?? You can let us know via the form at the end of this piece or you can contact the author via Twitter @nickcawley1.


