Article by IG Senior Market Analyst Axel Rudolph
FTSE 100, DAX 40, and S&P 500 Analysis and Charts
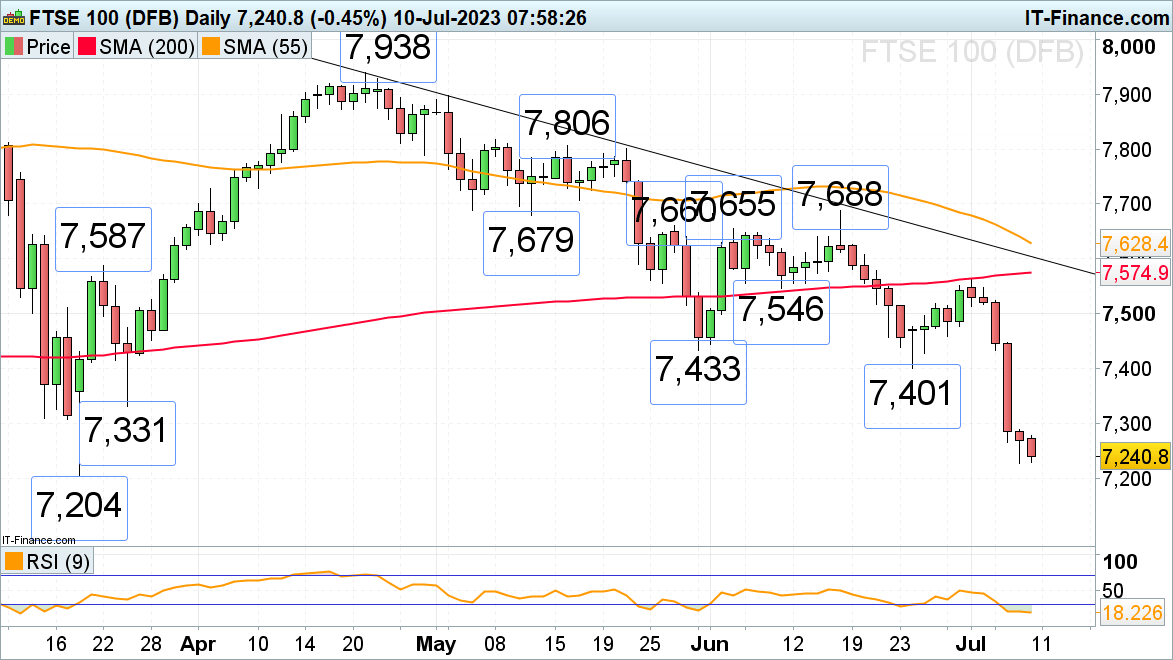
The FTSE 100 is fast approaching its March low at 7,204 as the UK 2-year yield trades at 16-year highs and China’s economy remains sluggish.
China's factory-gate prices for June experienced the most significant decrease in seven-and-a-half years, while consumer inflation stayed unchanged and reached its lowest point since 2021. Even though these economic indicators suggest that China's policymakers may need to introduce more stimulus measures to boost sluggish demand, the short-term impact on most Asian stock markets has been negative on Monday, weighing on the European open.
A fall through 7,204 would bring October 2022 high and November 2022 low at 7,104 to 7,071 to the fore. Minor resistance comes in at Thursday’s low at 7,266 and further minor resistance can be spotted at the 7,296 December low and also at the 7,331 24 March trough.
FTSE 100 Daily Price Chart

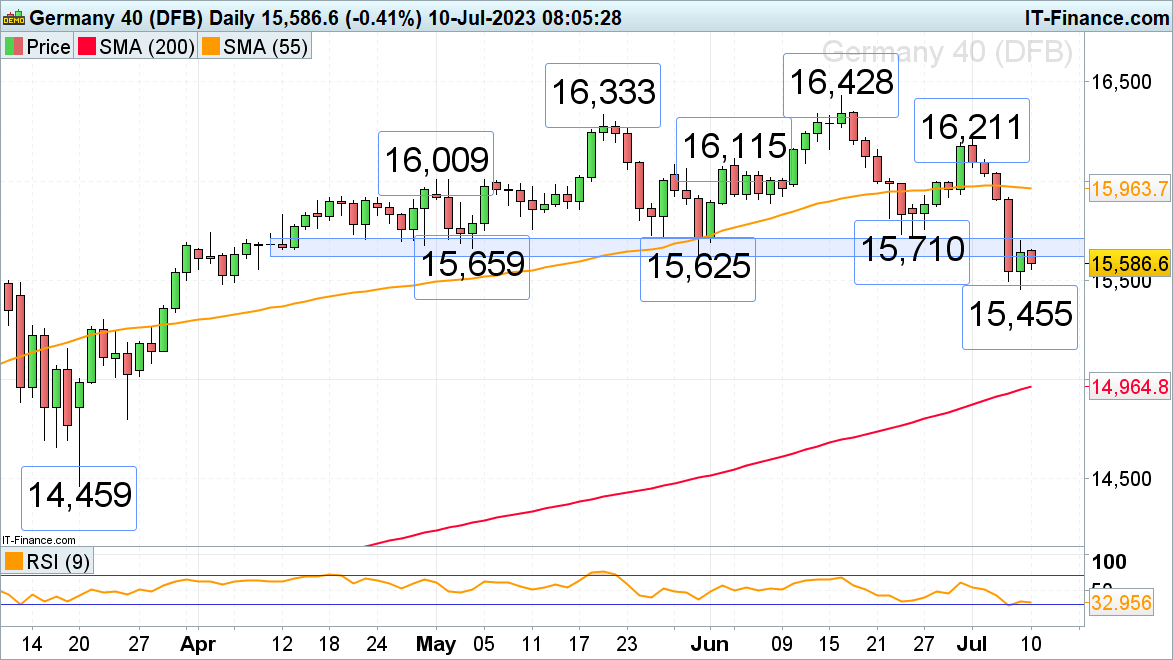
DAX 40 struggles at key resistance
Last week’s fall through its April-to-July major 15,710 to 15,625 support zone on the back of strong US jobs data and downwardly revised German manufacturing PMI which pointed to a weak German economy meant that the DAX 40 index formed a medium-term technical top. On Friday the index tried to bounce back but was capped by this, because of inverse polarity, now the resistance area at 15,702.
While no rise above 15,710 is seen, the odds will favor further downside bias with last week’s low at 15,455 remaining in sight. If fallen through, the mid-January and late March highs at 15,305 to 15,272 ahead of the 200-day simple moving average (SMA) at 14,965 may also be reached.Resistance at 15,702 to 15,710 is expected to thwart any attempt of a bullish reversal taking place today. If it were to happen, however, the 15,800 region could be reached this week.
DAX 40 Daily Price Chart

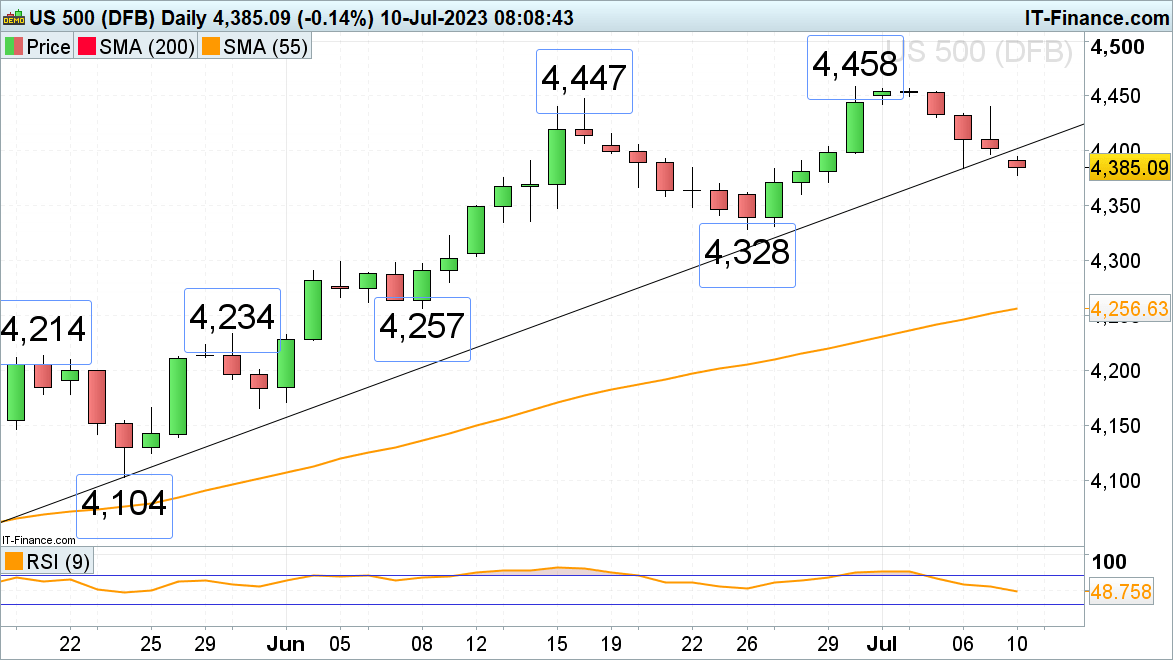
S&P 500 remains under pressure on US-Chinese trade tensions
The S&P 500 seems to continue last week’s slide on risk-off sentiment as central banks are expected to pursue their tightening monetary policy despite Friday’s weaker-than-expected US non-farm payrolls and as US-Chinese trade relations sour. A slip through last Thursday’s low at 4,389 would engage the late June low at 4,328. A drop-through and daily chart close below this level would point to a significant top being formed.
Minor resistance above Friday’s low at 4,397 can be found between last Wednesday’s low and Thursday’s high at 4,430 to 4,434.
S&P 500 Daily Price Chart