Article by IG Senior Market Analyst Axel Rudolph
FTSE 100, DAX 40, S&P 500 Prices, Analysis, and Charts
Foundational Trading Knowledge
Find Your Trading Style
Recommended by IG
FTSE 100 stabilizes ahead of the start of U.S. earnings season
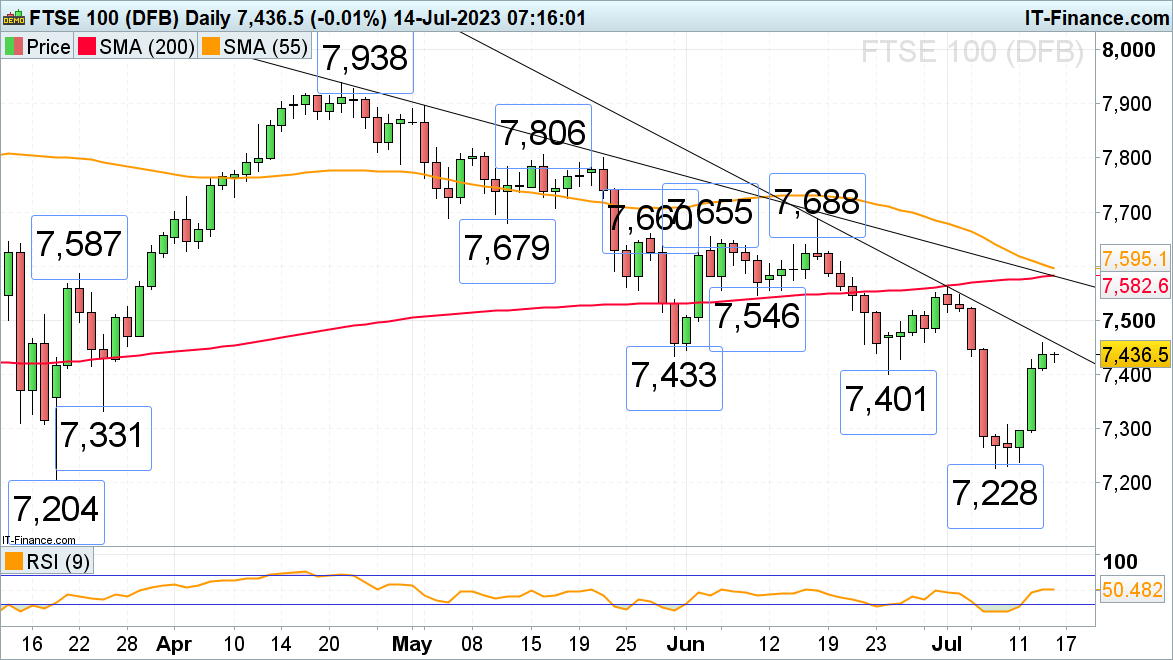
The FTSE 100’s three-consecutive day rise is losing upside momentum ahead of major U.S. earnings results out later today and as it approaches the June-to-July downtrend line at 7,459. If it and Thursday’s high at 7,459 were to be exceeded, the way would be open for the 9 June low, April-to-July downtrend line, 200- and 55-day moving averages at 7,546 to 7,595 to be reached.
Minor support can be found at the 7,401 late June low.
FTSE 100 Daily Price Chart

DAX 40 has seen five days of consecutive gains
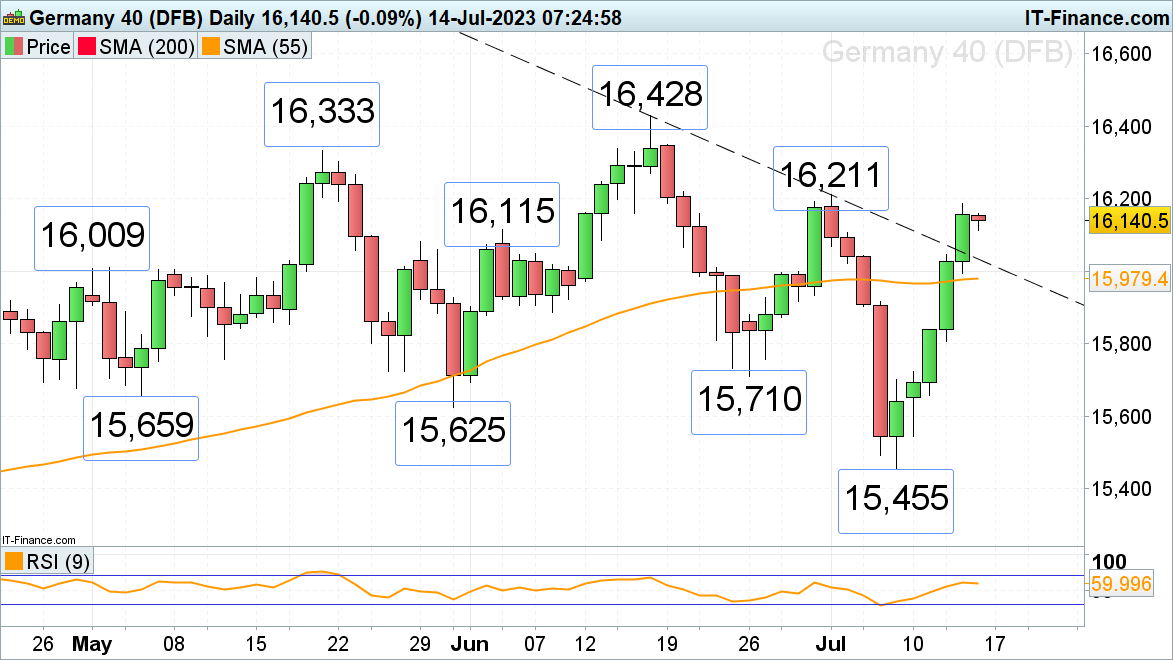
The DAX 40 has now risen on five consecutive days as U.S. inflation abates and the odds of further Fed rate hikes diminish and that of a soft landing increases. The early July high at 16,211 is now within reach, a rise above which could lead to the May peak at 16,333 being reached next.
Slips should find support along the breached June-to-July downtrend line at 16,036 below which the 55-day simple moving average (SMA) can be spotted at 15,979.
DAX 40 Daily Price Chart
S&P 500 trades at 16-month highs
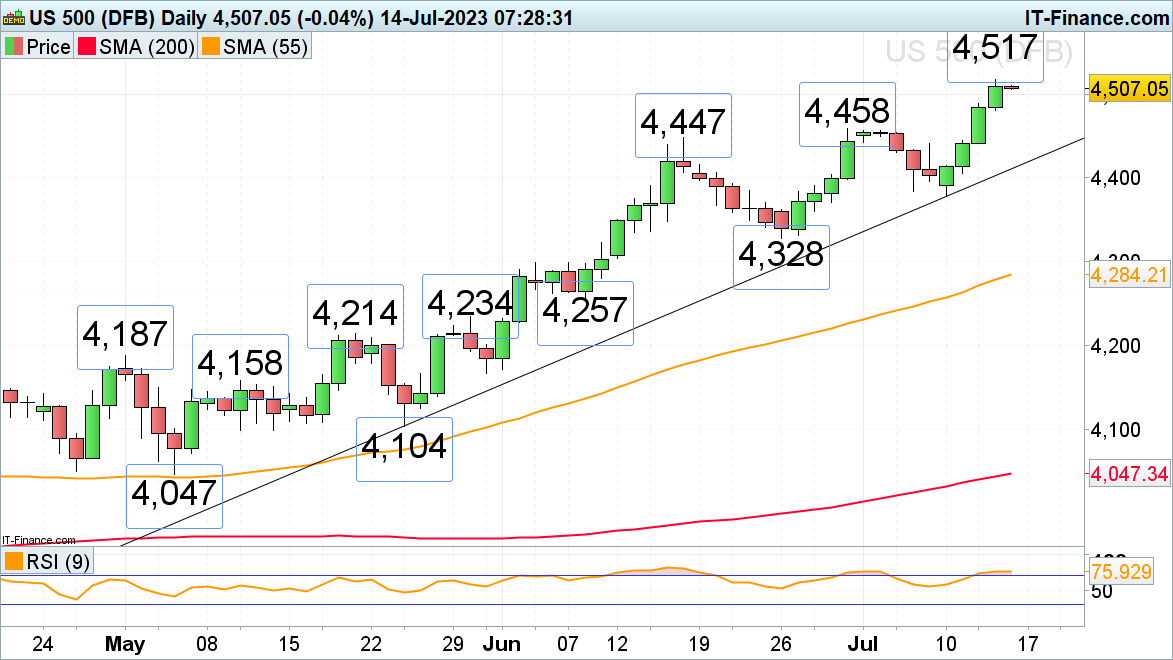
Following four consecutive days of rising prices taking the S&P 500 to a new 16-month high, the index may lose some upside momentum on profit-taking ahead of the weekend and as JPMorgan, Citigroup, Wells Fargo, and global fund titan Blackrock kick off the Q2 earnings season on Friday. Above Thursday’s 4,517 high lies the 8 April 2022 peak at 4,525 and still further up the 4,530 late December 2021 low.
Below Thursday’s low at 4,481 sits strong support between the mid- to late-June highs at 4,458 to 4,447.
S&P 500 Daily Price Chart