Article by IG Chief Market Analyst Chris Beauchamp
Dow Jones, Nasdaq 100, Nikkei 225 Analysis and Charts
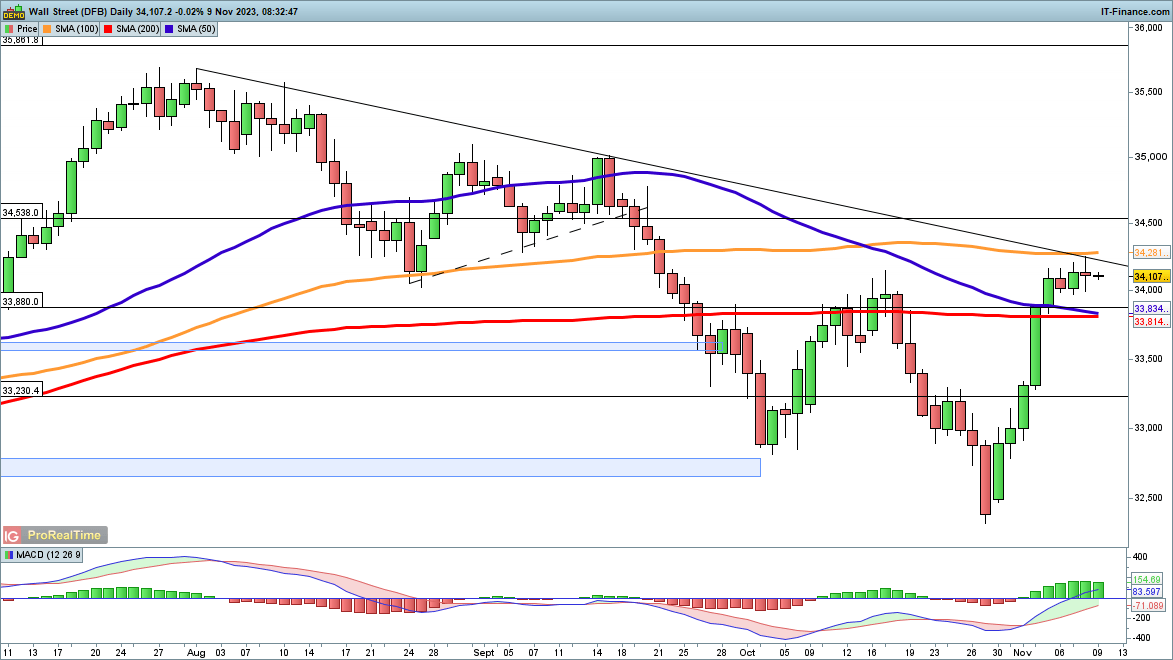
Dow returns to trendline resistance
The index has seen its momentum fade after the huge gains of the past week, though it continues to hold above the 200-day simple moving average (SMA). Wednesday saw the index touch trendline resistance from the July highs, for the first time since early September. A push above this line would be a clear bullish development, and open the way towards the highs of early September towards 35,000.
For the moment there is no sign of any downside momentum, but a close below the 200-day SMA might signal that some fresh short-term weakness has begun.
Dow Jones Daily Chart

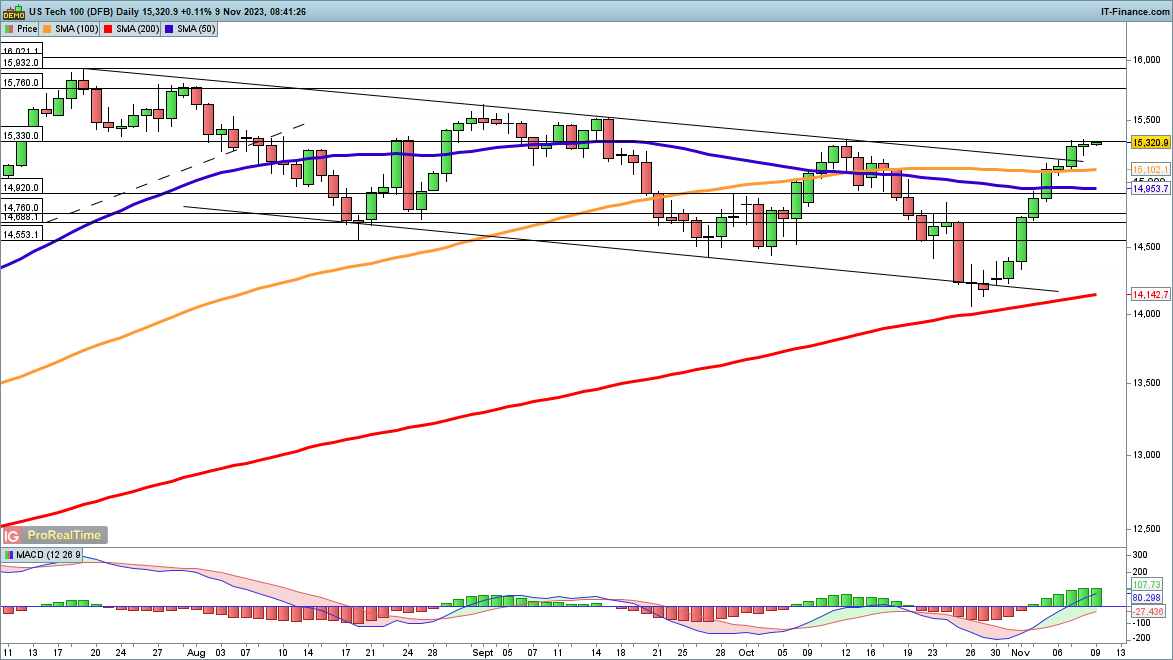
Nasdaq 100 continues to tiptoe higher
This index has been able to push above trendline resistance, moving outside the descending channel in place since the end of July.It finds itself back at the early October highs at 15,330 and now needs a close above this level to break the previous lower high. From there, the 15,600 area from early September comes into view.
A reversal back below 15,000 puts the index back inside the descending channel and reinforces the bearish short-term view.
Nasdaq 100 Daily Chart

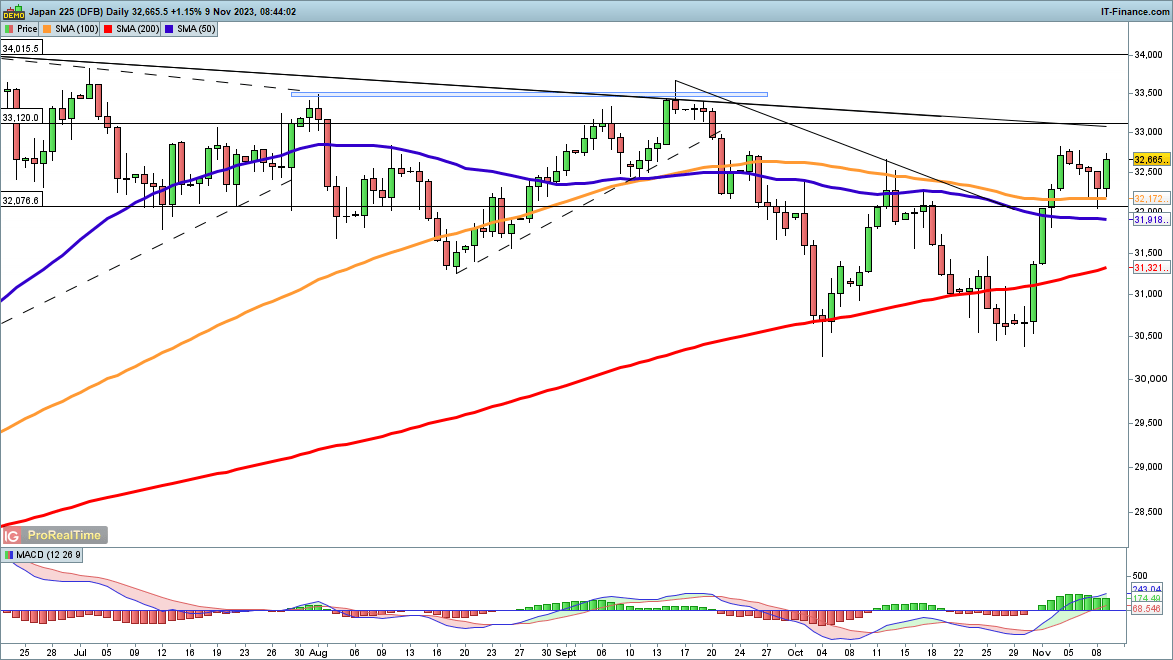
Nikkei 225 bounces off 100-day moving average
After weakening over the past four sessions, the index has seen a revival. The price briefly moved below the 100-day SMA yesterday, but avoided a close below this indicator, with it now acting as support as opposed to resistance as it was in early October. This could now see the index push towards 33,000 and trendline resistance from the 2023 high. Above this comes the September high of around 33,450.
Sellers will need a reversal back below 32,000 to suggest that a new leg lower could be underway.
Nikkei 225 Daily Chart