Article by IG Chief Market Analyst Chris Beauchamp
Dow Jones, Nasdaq 100, CAC 40 Analysis and Charts
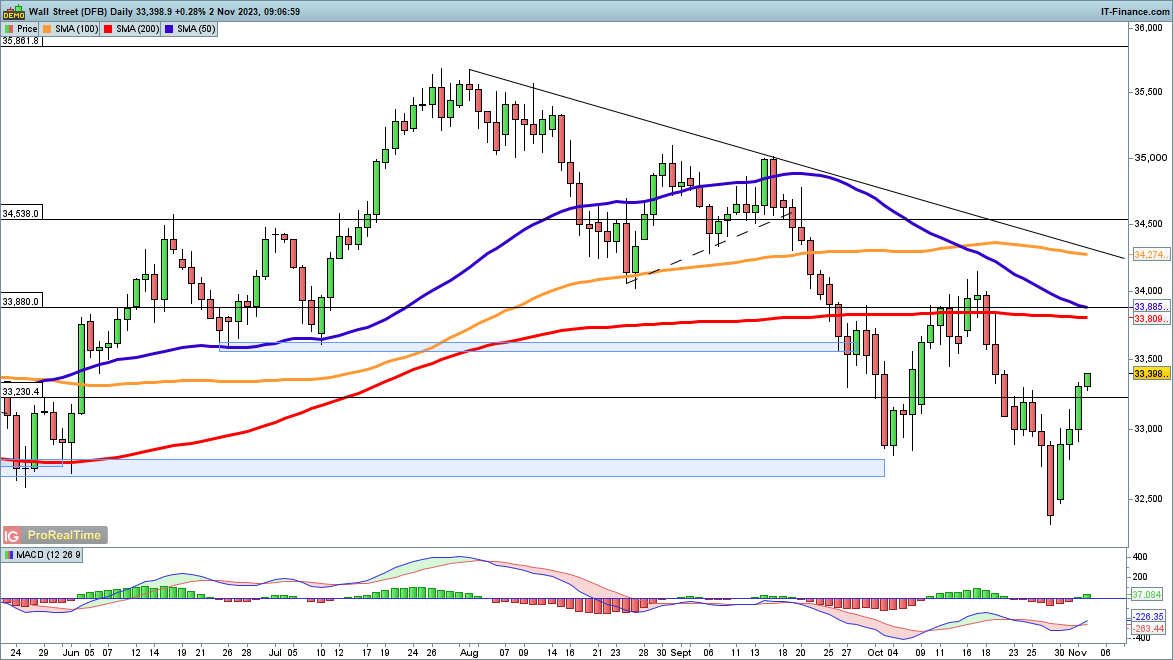
Dow stronger in wake of Fed decision
The index’s rally was given fresh impetus by the Fed decision last night, which saw a more balanced outlook from Jerome Powell. The index has climbed to its highest level in two weeks, continuing its rebound from the lower low. The next target is the 200-day SMA, followed by the 34,000 level.
Sellers will need a reversal back below 33,000 to negate the short-term bullish view.
Dow Jones Daily Chart
See How IG Sentiment Affects the Outlook for the Dow Jones
| Change in | Longs | Shorts | OI |
| Daily | -4% | 15% | 6% |
| Weekly | 14% | -1% | 5% |
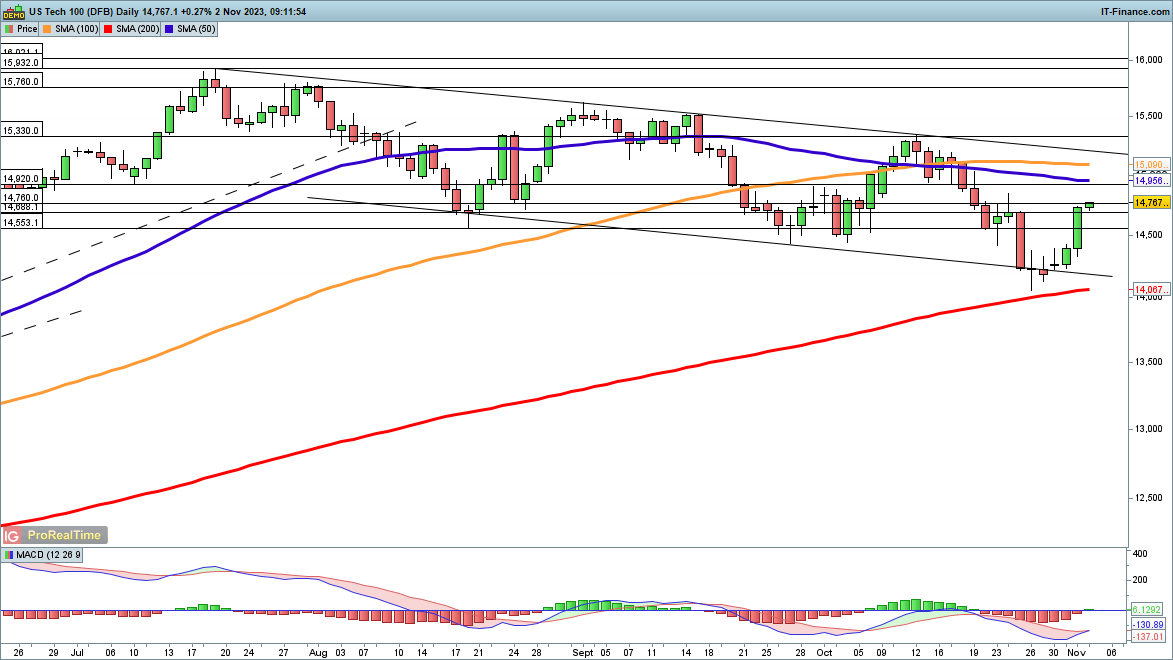
Nasdaq 100 rebound goes on
The rally in this index gathered pace yesterday too. The upper bound of the current descending channel now comes into play as a potential near-term target.Beyond this, the early October high at 15,330 comes into view. This would then see the price back above the 50- and 100-day SMAs helping to revive the medium-term bullish view.
A reversal back below 14,500 cancels out this view for now.
Nasdaq 100 Daily Chart

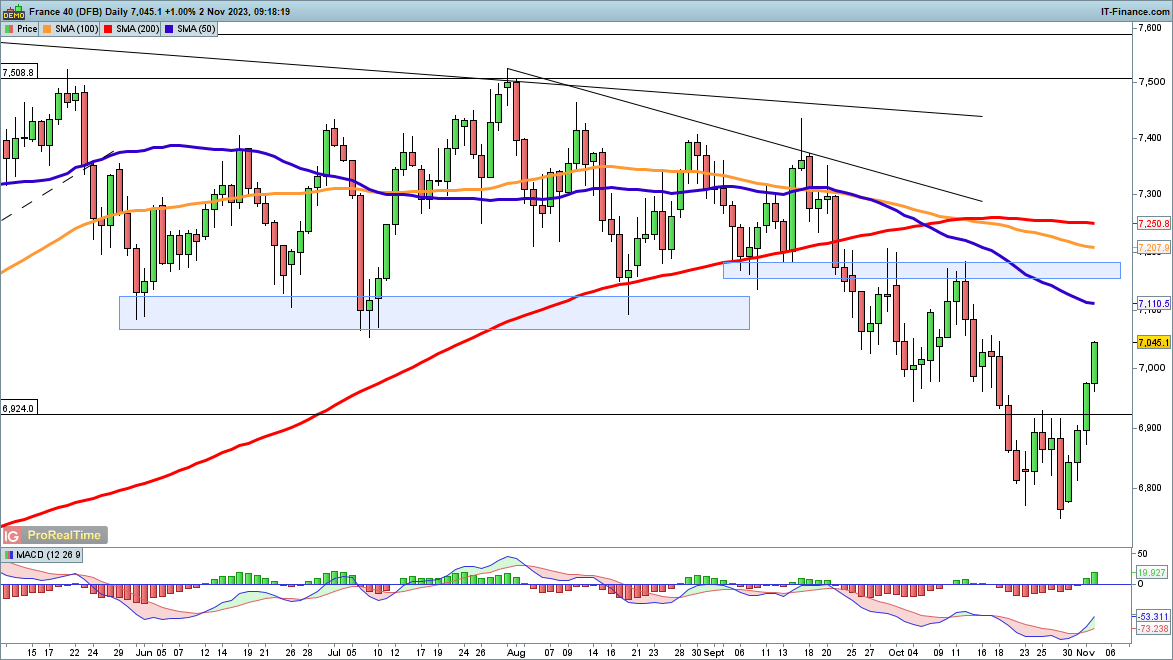
CAC40 sees fresh gains
A solid rebound continues here, though from a lower low within the context of a broader downtrend from the July highs.Further gains target the 7170 area that marked resistance in late September and was previously support in late August.
A failure to break above 7170 could mark a short-term top, and indeed a reversal below 7100 could also result in fresh selling pressure developing.
CAC 40 Daily Chart