Article written by IG Chief Market Analyst Chris Beauchamp
Dow Jones, CAC 40, Nasdaq 100 Analysis and Charts

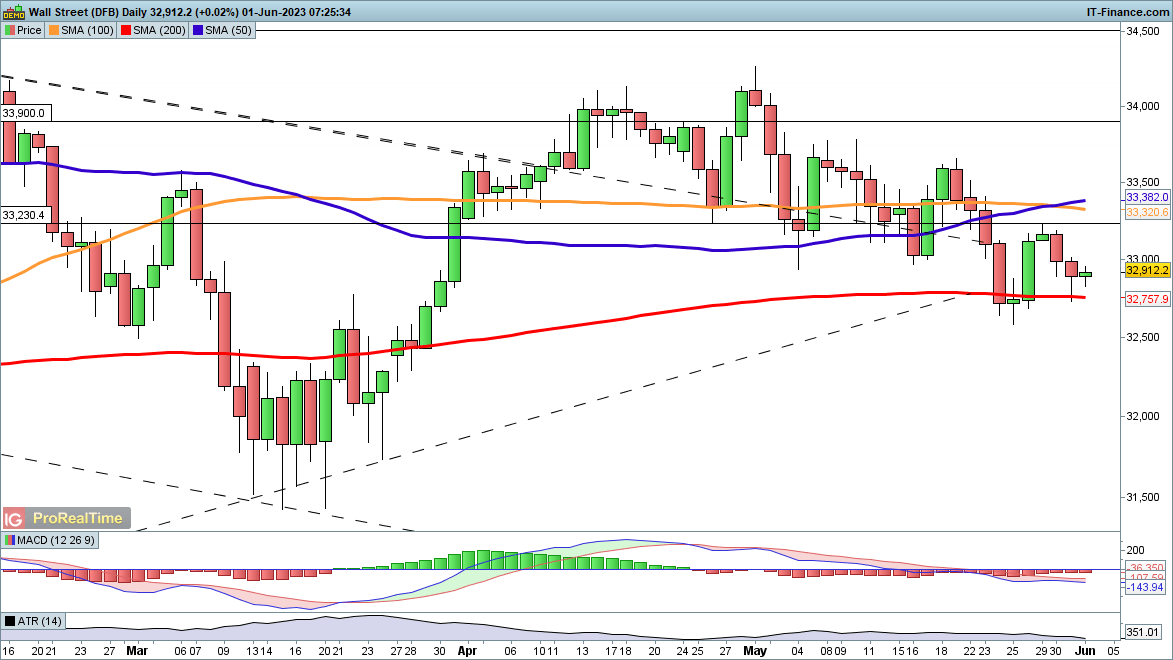
Dow holds above 200-day MA
The index saw a rally off the lows of yesterday’s session, defending the 200-day SMA once again.
However, the overall lower from the highs of May has yet to be disrupted, so further upside would be needed to suggest that a low has been created. A move above 33,230 would help to bolster such a view, and might then open the way to a rebound towards the mid-May high at 33,690.
A reversal below the 200-day SMA opens the way to the low seen last week around 32580.
Dow Jones Daily Price Chart - June 1, 2023

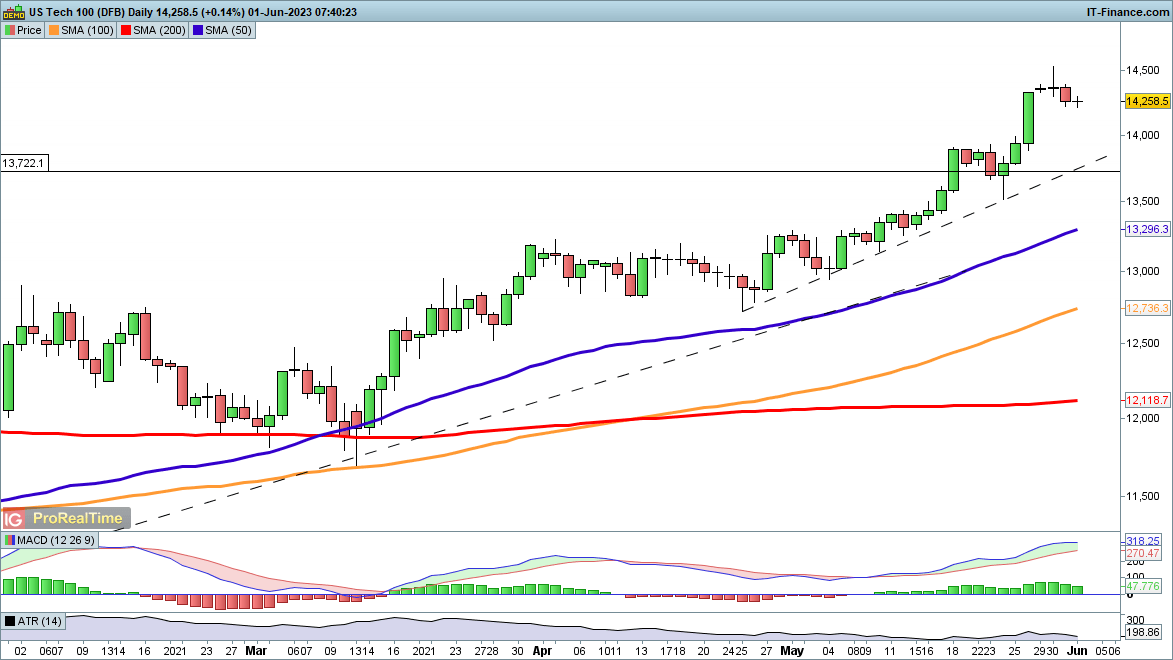
Nasdaq 100 edges lower
A drop yesterday saw the index add to its decline from the one-year high hit on Tuesday.
The upward move is still firmly intact, but it may be overextended in the short term. Trendline support from late April could come into play closer to 14,000. A deeper retracement might develop with a move below 13,700.
A renewed move higher could target the late March 2022 highs at 15,210, but a consolidation after the recent run higher remains a distinct possibility.
Nasdaq 100 Daily Price Chart - June 1, 2023
Trade Smarter - Sign up for the DailyFX Newsletter
Receive timely and compelling market commentary from the DailyFX team
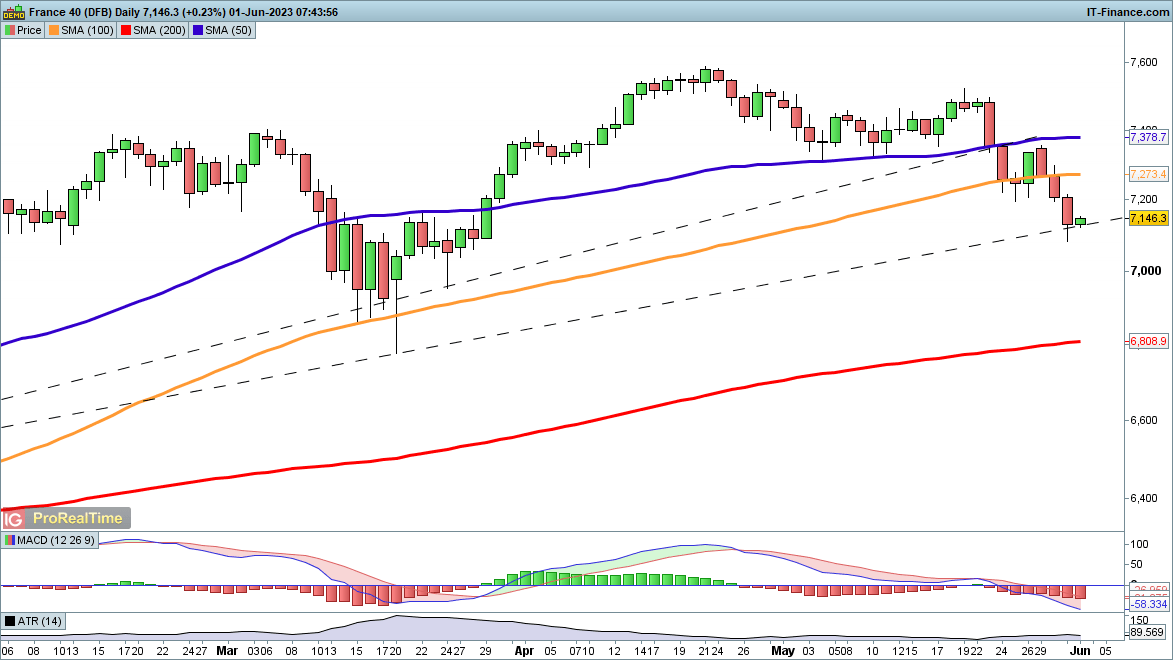
CAC40 hits trendline support
Losses here accelerated to a fresh two-month low yesterday, although it has rallied off the lows of the session.
The longer-term uptrend is still intact, though it has taken a knock since the April peak. A recovery above the 100-day SMA would help to reinforce the view that a higher low is in place and that a move back to 7600 and potentially higher could be in play.
The price has stabilised around another potential trendline support level from the December lows. Should this hold then the bullish view could receive additional support. Below this, the March low at 6785 comes into view.
CAC40 Daily Price Chart - June 1, 2023