Article by IG Chief Market Analyst Chris Beauchamp
Dow Jones, Nasdaq 100, CAC 40 Analysis and Charts
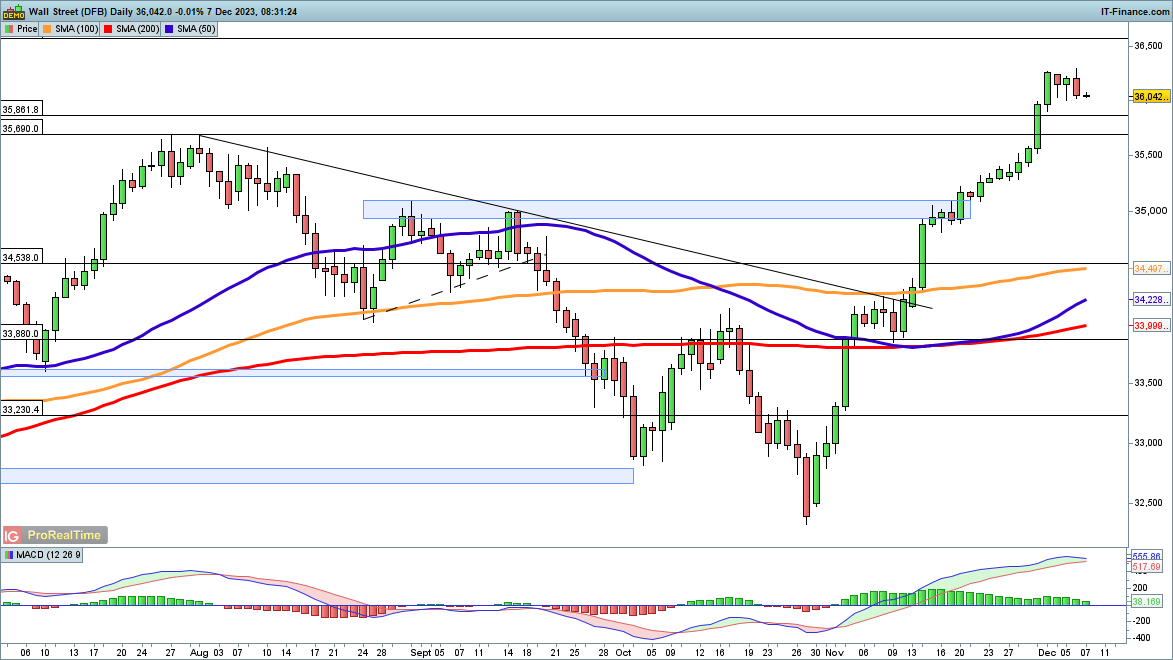
Dow edges off highs
The index continues to trim the gains made last week, with Wednesday’s session seeing its largest drop in a month as energy stocks fell sharply thanks to fresh declines in oil prices. However, for the moment a more sustained pullback has yet to develop. Upward momentum has faded, but the price remains above the August highs.
Additional gainscontinue to target 36,570, and then on to the record highs at 36,954.
Dow Jones Daily Chart

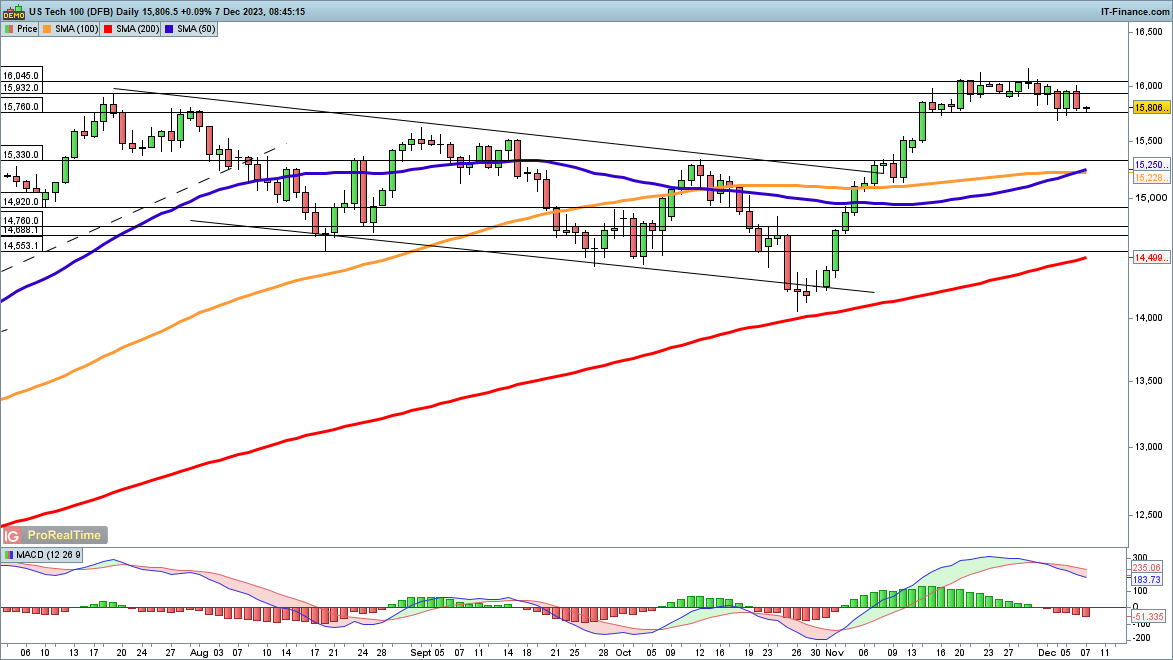
Nasdaq 100 fights to establish a direction
This week has seen a see-saw movement in the index; Monday’s losses were reversed by Tuesday’s gains, which were then countered by Wednesday’s drop. The price is hovering above 15,760 support, and a fresh drop below this might then see the price head back toward the 50-day simple moving average.
Buyers will be looking for a close back above 16,100 to suggest that a new leg higher has begun.
Nasdaq 100 Daily Chart
Trade Smarter - Sign up for the DailyFX Newsletter
Receive timely and compelling market commentary from the DailyFX team
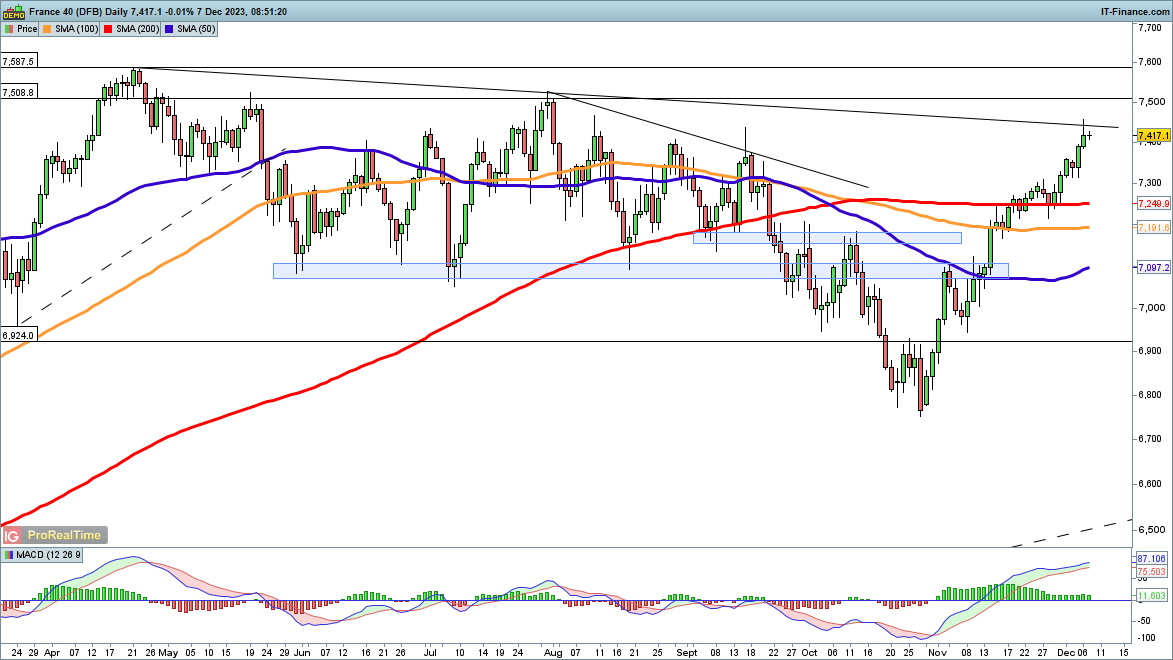
CAC40 struggles around trendline resistance
The price briefly pushed above trendline resistance from the April high yesterday, but after the huge gains since late October, it is perhaps not surprising that it was unable to hold above the trendline. Like several other indices, the price shows no sign of slowing down or reversing – the consolidation around the 200-day SMA in mid-November seems to have been sufficient for the time being.
A close back below 7350 might signal a pullback is beginning, while a close above post-April trendline resistance would then see the price target the late July high at 7526.
CAC40 Daily Chart