


Ever since March 7th lows at 12441, DAX has been trading sideways as eventually coils into a long-term triangle. Currently, DAX is sitting in between a support and resistance which give a good indication where the index is looking to go in the near-term future.

DAX (German 40) 8 Hour Chart
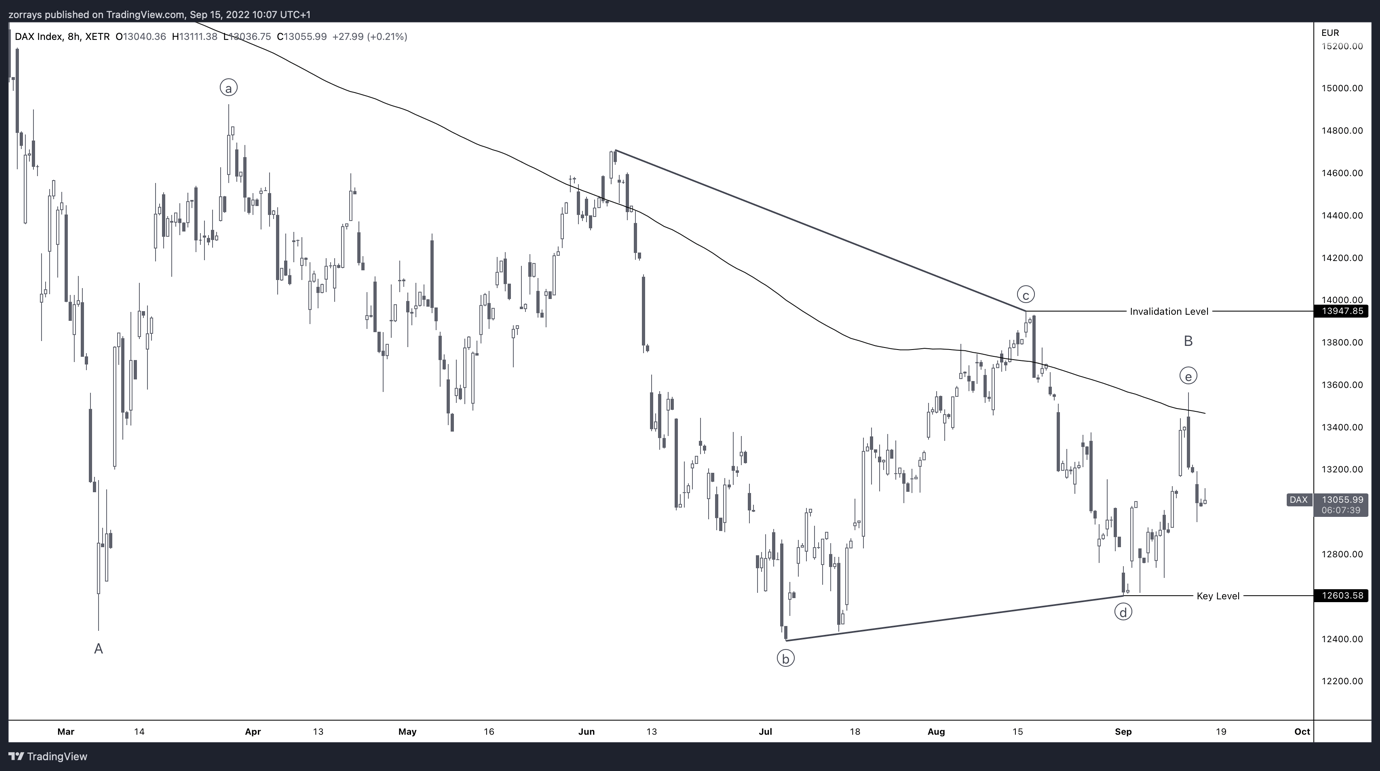
Chart prepared by Zorrays Junaid using TradingView
DAX has a key level at 12603 to break wave ((d)) of this Elliott Wave based triangle which consists of 5 sub-waves (ABCDE). The break of this key level would indicate that this triangle is triggered a further decline to favour the overall trend is in play.
On the other hand, should price break through just below 14000 invalidation level which is sitting at the extreme of wave ((c)), we can expect price to continue to the upside for a short term to correct this bearish sequence DAX is unfolding within.
DAX has been rejecting off the 200 Moving Average consistently throughout this consolidation period and is still trading below it.
Let’s look at the bigger picture.
Trade Smarter - Sign up for the DailyFX Newsletter
Receive timely and compelling market commentary from the DailyFX team
DAX (German 40) Daily Chart
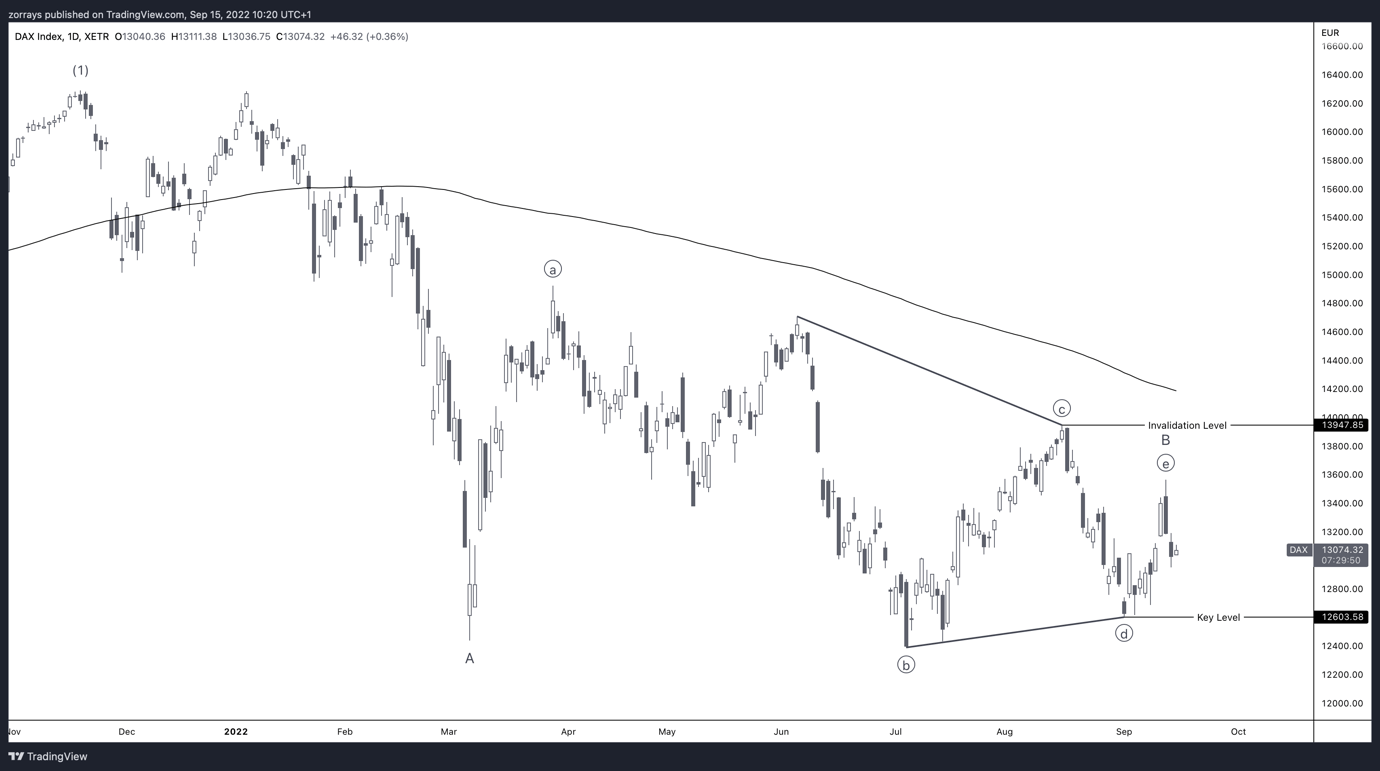
Chart prepared by Zorrays Junaid using TradingView
The bigger picture illustrates that from January 2022 high at 16288 has been in a bearish sequence which in Elliott Wave Theory is forming a Zig Zag corrective pattern. DAX is currently in wave B which is getting ready to thrust to the downside into wave C and unfold as an impulse wave.
Triangles within Elliott Wave signify that the next impulse wave thrusting out of the triangle is the final wave prior to this whole sequence in this degree to complete.


