
Crude Oil Price Analysis and Charts
• Crude oil prices have risen by more than $2/barrel
• News of another tanker seizure brought buyers out
• Chinese trade numbers Friay may bring focus back to economic woes
Download the brand new Q4 Oil forecast below:

Crude Oil prices rose quite sharply in Asian and European trade on Tuesday as signs of increasing geopolitical tensions in the Middle East brought out buyers. The United Kingdom’s monitoring Maritime Trade Operation reported early in the session that a Marshall-Islands-flagged oil tanker had been boarded and taken over by uniformed men in the Gulf of Oman, with other reports suggesting that Iran had claimed responsibility. The situation remains unclear, however, and what links there may be between this action and the shooting down of Houthi drones by the United States and UK this week is still unknown.
Even so, the energy market remains nervous, unsurprisingly, given the pivotal importance of the region to global energy supply. The price of US benchmark West Texas Intermediate crude rose by more than $2/barrel in Europe. Supply uncertainties sparked by the ongoing conflict between Israeli forces and Hamas in Gaza have seen prices shake out of the downtrend that began back in October.
Even so, the market remains concerned about end-user demand, especially from major importer China which remains mired in a nasty if patchy economic slowdown, deflation, and all. While the prospect of lower borrowing costs and victory in the US inflation fight might seem bullish for the energy market, it’s far from clear how soon and how deep rate cuts there will be. Headline inflation ticked up a little in December, according to official figures Thursday and, while the more important core rate continued to relax, even that came in above forecasts.
The market is also looking at a steady growth in available oil supply from countries outside the Organization of Petroleum Exporting Countries and its associate member states. Indeed, despite some current price vigor it’s not hard to find a lowered forecast these days. Reuters reported on Thursday that Barclays had lowered its 2024 Brent benchmark forecast by $8 to $85/barrel. That doesn’t imply a lot of upside this year, given that prices are already at $78.
The next scheduled major event for this market will be official Chinese trade numbers. They’re coming up on Friday.
Learn How to Trade Oil:

US Crude Oil Technical Analysis
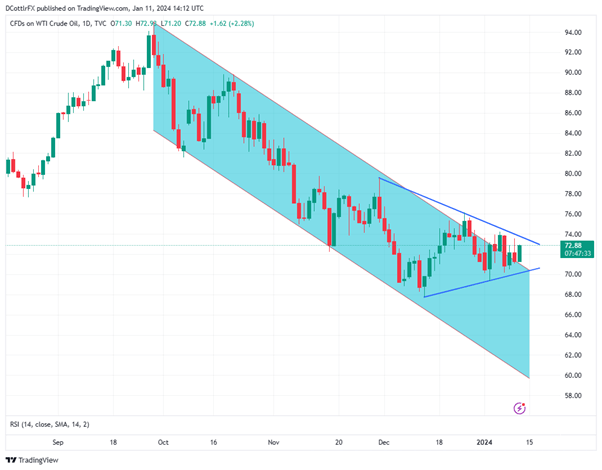
US Crude Oil Daily Chart Compiled Using TradingView
Prices have overcome the top of their previously dominant broad downtrend channel, but they haven’t yet done so very convincingly and there could be more bad news for bulls in the chart.
The conjunction of lower highs and higher lows that form a classic ‘pennant’ formation is starting to become clearer in the price action. The pennant is what’s known as a continuation pattern which means that the previous trend is likely to reassert itself once the formation plays out. Clearly, this would mean that the former downtrend takes control again.
Of course, these things aren’t infallible and, combined with elevated fundamental uncertainty, it might be advisable to wait and see how this particular pennant fades out before getting too involved in the market. If bulls can arrange a break above the latest downtrend line, and, perhaps, a return to December 26’s intraday high of $76.01, that might be a sign that there’s a bit more upside fight in prices than there now seems.
However, a slide back into the old downtrend which now offers support at $70.94 looks a bit more likely and could be more obviously bearish, with psychological support at the $70 figure awaiting below.Bulls may draw some comfort from the fact that WTI looks in no way overbought yet, with the Relative Strength Index hovering at a relaxed 50 or so. That indicator doesn’t trigger a warning of extreme overbuying until it gets up to 70.
IG’s own sentiment data finds traders very bullish at current levels, clearly sharing the broader market’s geopolitical concerns. However, with fully 84% now long, the lure of the contrarian, bearish trade will probably only get stronger.
| Change in | Longs | Shorts | OI |
| Daily | 7% | -3% | 3% |
| Weekly | -13% | 14% | -6% |
--By David Cottle for DailyFX