


Germany’s data release this week will highlight where the Eurozone and the DAX could be heading in the near-term future. Tomorrow’s CPI data for Germany will determine whether inflation has reached it’s peak and will reduce. This would allow the ECB to relax their hawkish stance. The market is currently priced in for another rate hike at best on 15th December or kept the same at 2%.
Should Germany’s data release worse than expected and inflation does not seem to be contained, we could expect a negative effect on the EURO and the DAX.

DAX Daily timeframe – November 28th 2022
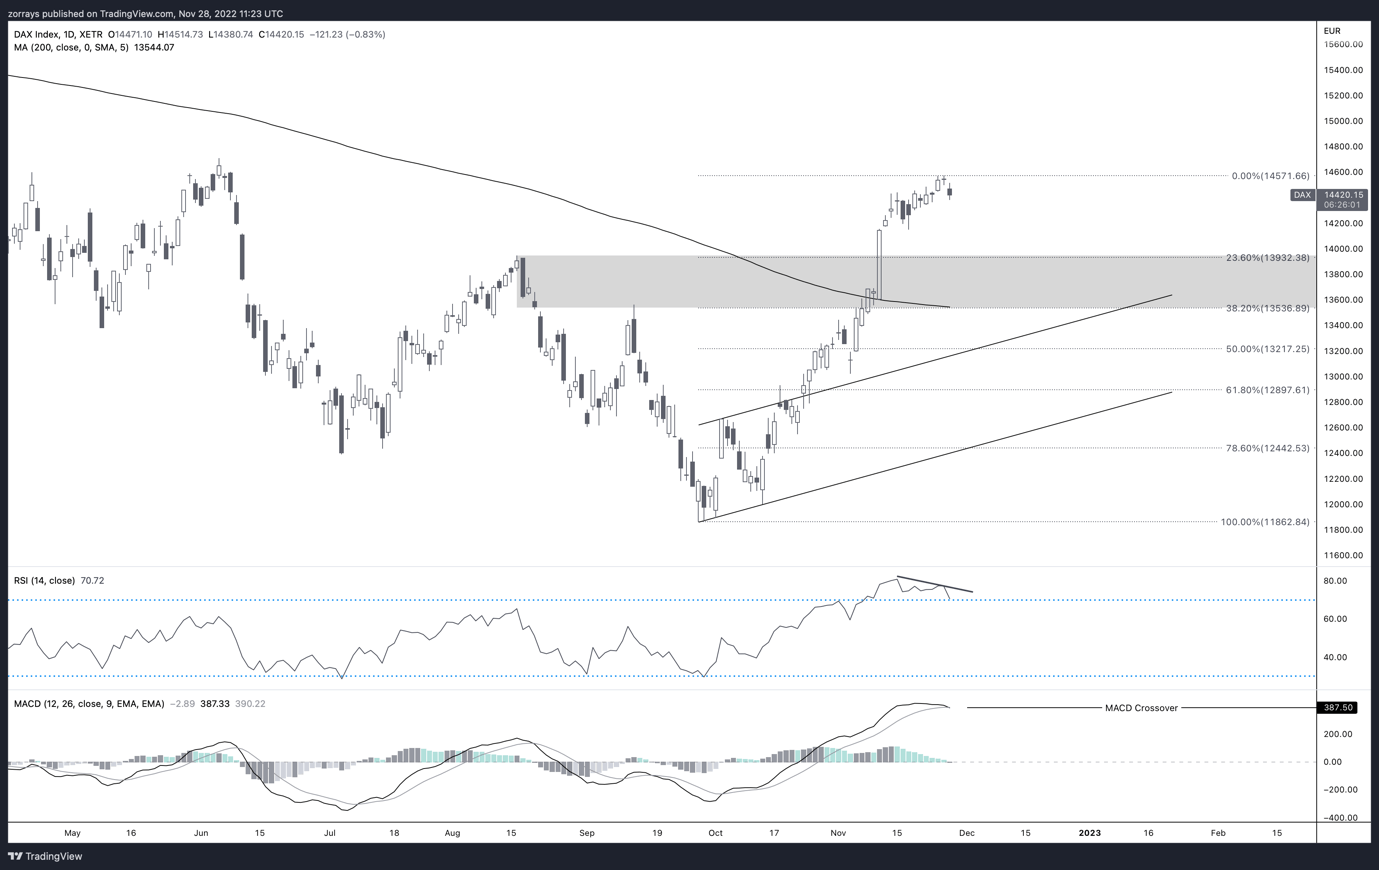
Chart prepared on TradingView by Zorrays Junaid
Since September 28th 2022 low at 11862, the DAX has appreciated up 22.83% up to last week Thursday. As it slowly approaches 14710 resistance area, I can see that the DAX’s rally is slowly running out of steam. The clues are on the chart.
One of them being the price action is going sideways since November 14th 2022 where DAX only appreciated in price by 0.90%. Secondly, the RSI momentum indicator has formed a clear divergence on the daily timeframe. As price formed a new high on November 24th, the RSI was formed a lower high. Finally, although the MACD is hovering in the bullish territory, we can see the MACD moving averages have crossed over to the downside.
If the price action will decline in a corrective manner, we may see price reduce to at least 23.6% to 38.2% retracement which confluences with the next support zone which is between 14000 - 13500. We potentially can see a bounce off the support area, the 200 day Moving Average and the upper bound of the ascending channel.
I think a correction at minimum is inevitable considering how extended the bullish rally is. If another leg to the downside is on the cards, then we could possibly witness a complete rotation to the downside.
--- Written by Zorrays Junaid, Contributor, DailyFX.com


