
GBP/USD and EUR/GBP Analysis and Charts
- The 2023 UK Annual National Accounts revise prior GDP releases higher.
- Next week’s economic calendar is uninspiring.
For all market-moving economic data and events, see the DailyFX Calendar
The newly released UK Annual National Accounts 2023 (Blue Book) show that the UK economy grew by more than previously thought in 2020 and 2021. The upward revisions to both years mean that GDP is now estimated to be 0.6% above pre-coronavirus levels pandemic levels in Q4 2021 against a previous estimate of 1.2% below, according to the Office for National Statistics (ONS). While the revisions are mainly due to the availability of ‘richer data’, at the margin it may make investors re-evaluate UK PLC and look at it in a slightly better light.
The latest US Jobs Report (NFP) showed 187k new jobs created in August, marginally higher than market expectations of 170k, while both the June and July headline figures were revised lower. The August unemployment rate however rose to 3.8% from 3.5%, while wage pressure eased marginally. The net effect was a little changed US dollar post release although the greenback has picked up a small bid heading into the weekend.
August Jobs Report: Payrolls Rise by 187k, Setting Gold and USD on Opposite Paths
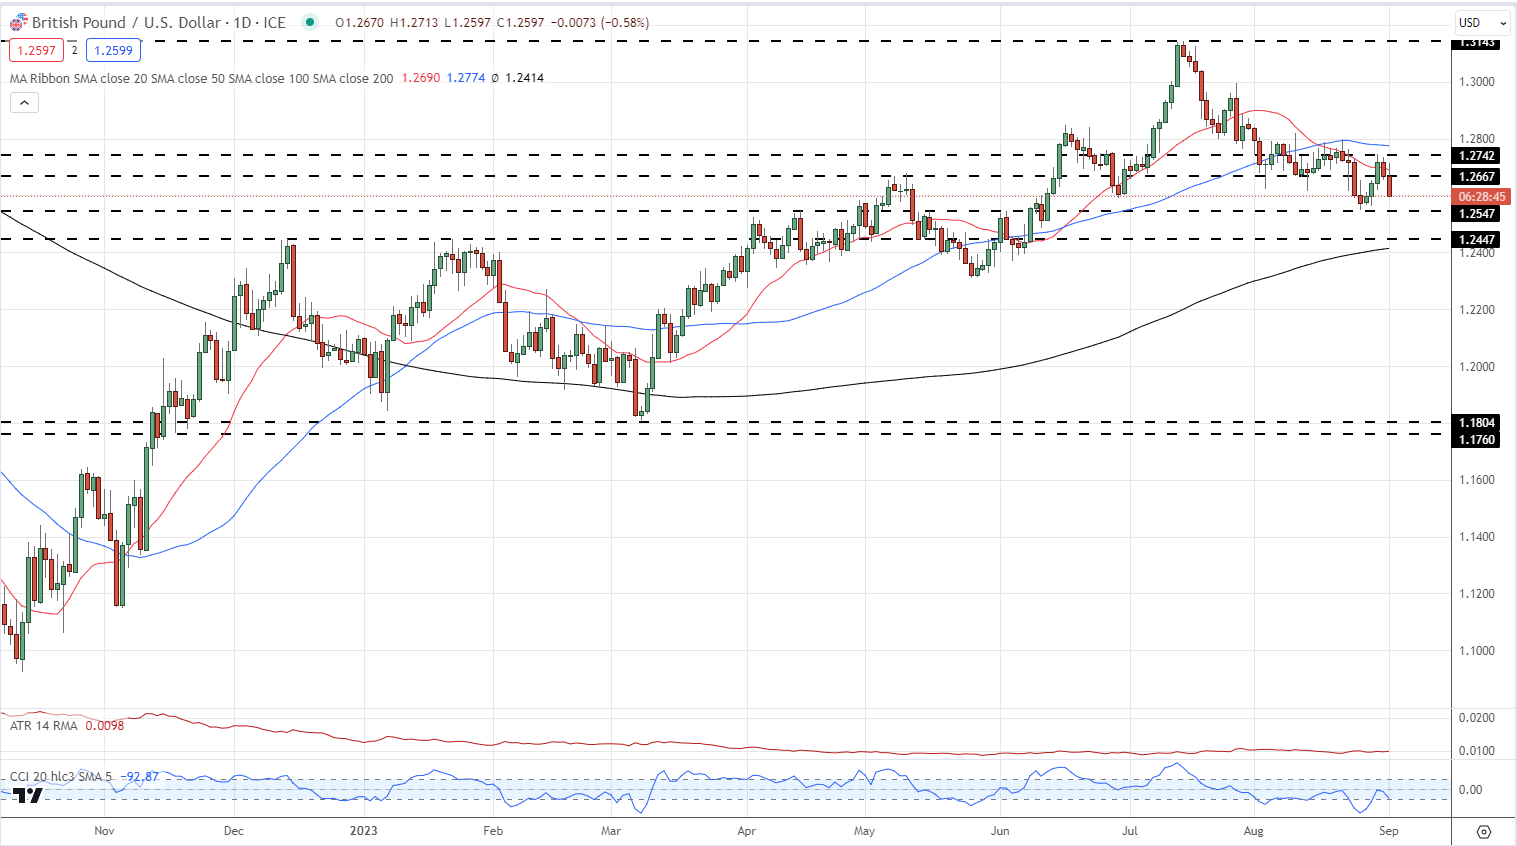
Cable is now testing 1.2600 after having traded as high as 1.2717 earlier in the session. The short-dated 20-day simple moving average is proving difficult to break and further selling would see GBP/USD test a multi-week low of 1.2547. Below here, a couple of older swing highs at 1.2447 loom into view.

GBP/USD Daily Price Chart September 1, 2023
See How GBP/USD Traders are Positioned
| Change in | Longs | Shorts | OI |
| Daily | -2% | 3% | 0% |
| Weekly | -9% | 1% | -4% |
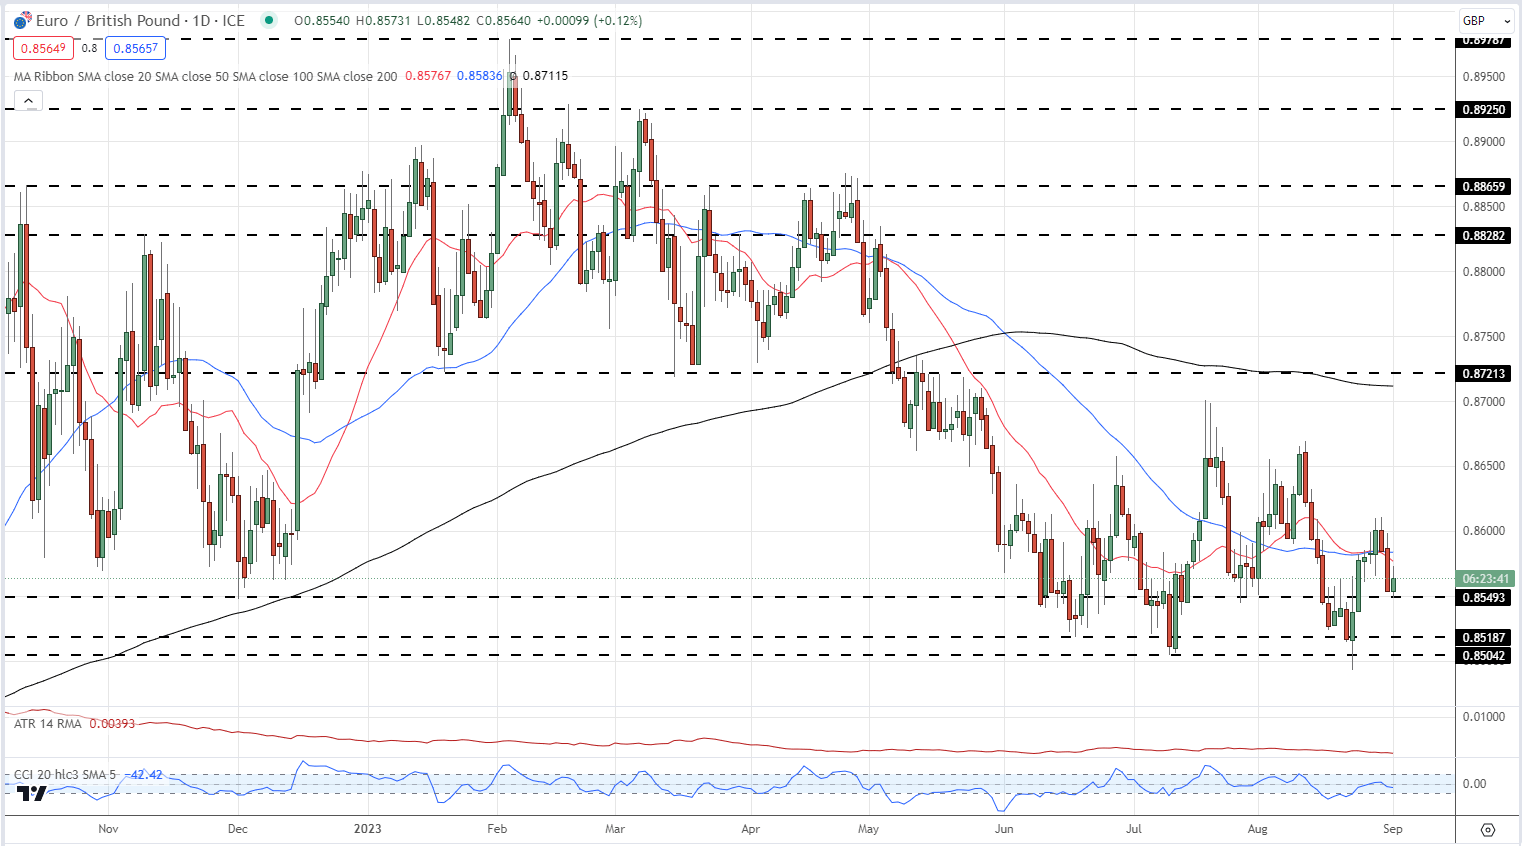
EUR/GBP continues to range trade but the latest daily chart does show a series of lower highs being formed by the pair since mid-July. The area of resistance is seen between 0.8600 and 0.8610, while the first level of support at 0.8549 was tested and held today. Below here 0.85187 and 0.85042 come into play.
EUR/GBP Daily Price Chart – September 1, 2023

What is your view on the British Pound – bullish or bearish?? You can let us know via the form at the end of this piece or you can contact the author via Twitter @nickcawley1.