


GBP/USD - Prices, Charts, and Analysis
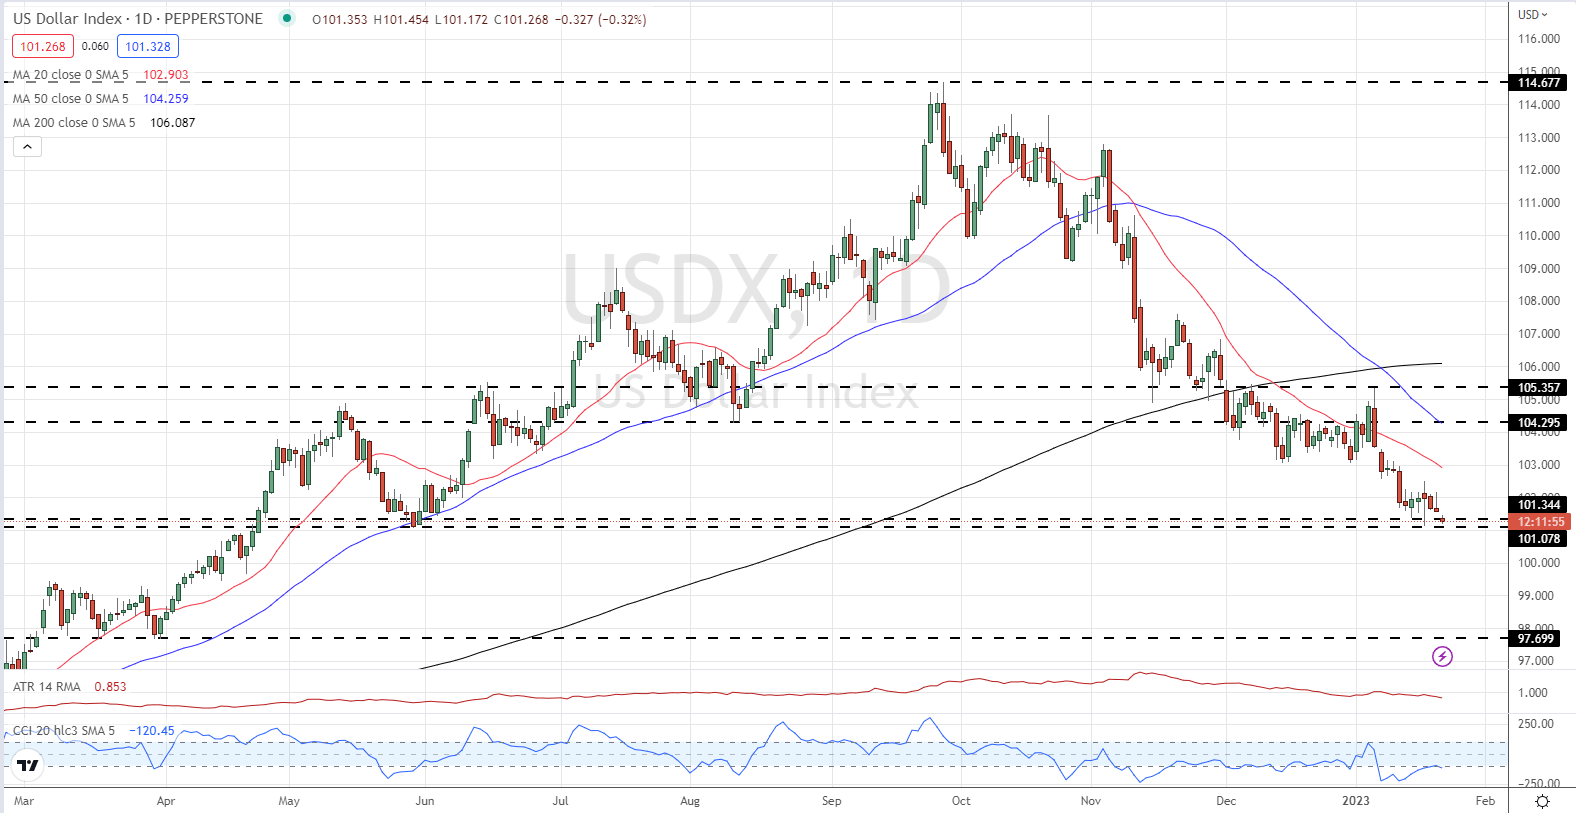
- US dollar index tests June 2022 lows.
- Cable may have further to go.
- Retail sentiment is bullish.

The Federal Reserve is set to hike interest rates by 25 basis points at the February 1 FOMC meeting and by a further 25 basis points at the next meeting in March, according to the latest CME Fed Fund data. The US central bank is then seen holding rates steady until Q4 when rate cuts are now being priced in. Compared to market predictions from one to two months ago, the market is betting that the Fed is going to slow monetary tightening in the weeks and months ahead.
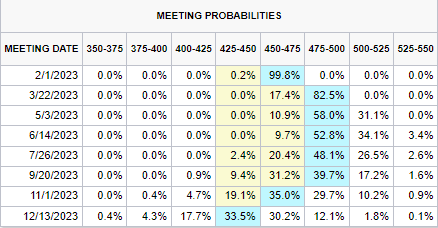
This perceived change in US monetary policy has hit the US dollar hard since late October last year. The move lower has been constant with any small upticks being sold into. The DXY is now sitting on multi-month support and a confirmed break lower will see the US dollar index test sub-100 prices.
US Dollar Index (DXY) – January 23, 2023
For all central bank policy decision dates see the DailyFX Central Bank Calendar

There are two high-importance data releases in the US this week, the first look at US Q4 GDP on Thursday, followed by Core PCE on Friday. These two releases will steer cable over the short term. The UK economic docket is slightly quieter and attention will turn to the current round of industrial action hitting the UK and the perceived thawing of UK/EU relations over the NI protocol. If a compromise can be found between the two sides, this should give both the Euro and the British Pound a mild boost.
GBP/USD is currently changing hands around 1.2400 after having tested, and rejected, the December multi-month high at 1.2447. This level remains in play and it is likely that cable will make another run at it soon. The moving average set-up is bullish and with little resistance between 1.2247 and 1.2667, traders are likely to push GBP/USD higher. The CCI indicator is in oversold territory, so a reset of this indicator may be needed before cable rallies further.
GBP/USD Daily Price Chart – January 23, 2023
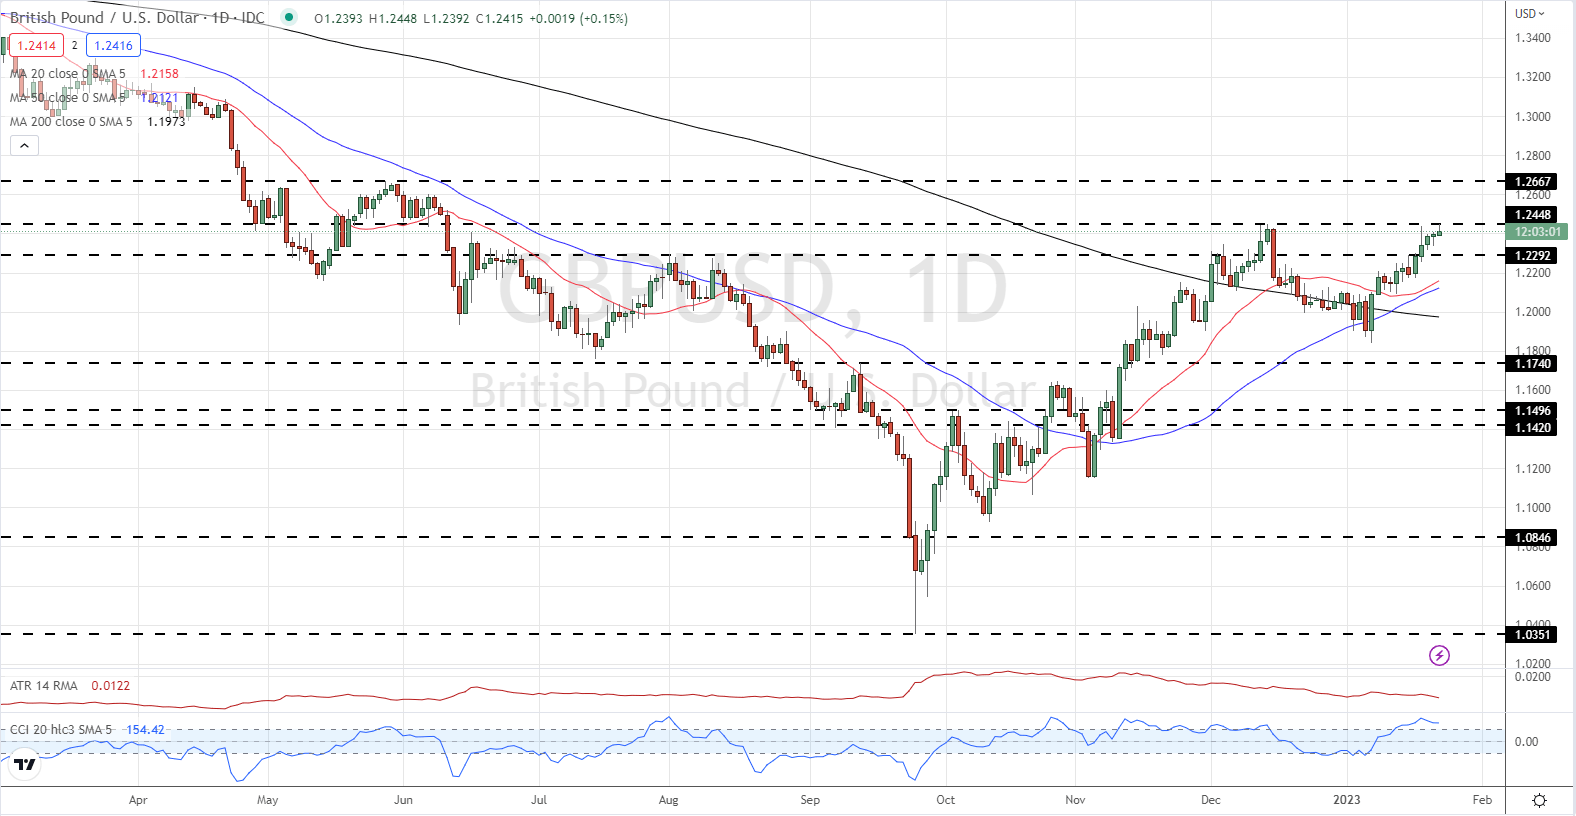
Chart via TradingView
| Change in | Longs | Shorts | OI |
| Daily | 3% | -7% | -3% |
| Weekly | 4% | -10% | -5% |
Retail Trader Bias Is Bullish
Retail trader data show 36.20% of traders are net-long with the ratio of traders short to long at 1.76 to 1.The number of traders net-long is 2.25% higher than yesterday and 17.85% lower from last week, while the number of traders net-short is 5.02% higher than yesterday and 28.54% higher from last week.
We typically take a contrarian view to crowd sentiment, and the fact traders are net-short suggests GBP/USD prices may continue to rise. Traders are further net-short than yesterday and last week, and the combination of current sentiment and recent changes gives us a stronger GBP/USD-bullish contrarian trading bias.
What is your view on the British Pound – bullish or bearish?? You can let us know via the form at the end of this piece or you can contact the author via Twitter @nickcawley1.


