


Brent Crude Oil Technical Analysis
- Brent crude oil breaks below the (bearish) rising wedge
- Upside momentum temporarily restricted at the 50 SMA
- IG client sentiment hints at a continued move lower as retail traders pile into longs
- The analysis in this article makes use of chart patterns and key support and resistance levels. For more information visit our comprehensive education library

Oil prices maintain the longer-term downward trajectory, helped this morning by another drop lower. Headlines around China’s reopening and rapid Covid infections are likely to influence shorter term price action but traders and investors are more concerned about the state of the global economy (including China) and how that may influence oil demand.
In the event of a mild and short-lived downturn for major economies, oil prices could see a rally into the end of 2023 – aided by persistent supply cuts from OPEC. However, the possibility of stubborn inflation prolonging economic headwinds can delay a boom in the oil market even longer. For now, the rapid rate of infections in China has some suggesting the worst is likely to be over by March/April – when prices may be due for a lift in anticipation of greater oil demand from the region.
Brent Crude Technical Analysis
The weekly chart helps identify key longer term support and resistance, or, possible pivot points. At present, the confluence zone, comprised of the 50% Fibonacci retracement of the major 2020 to 2022 move and the $76.05 level which acted as a pivot point in April 2019, July 2021 and December 2022, remains the nearest challenge for a bearish continuation.
Brent Crude Oil Weekly Chart
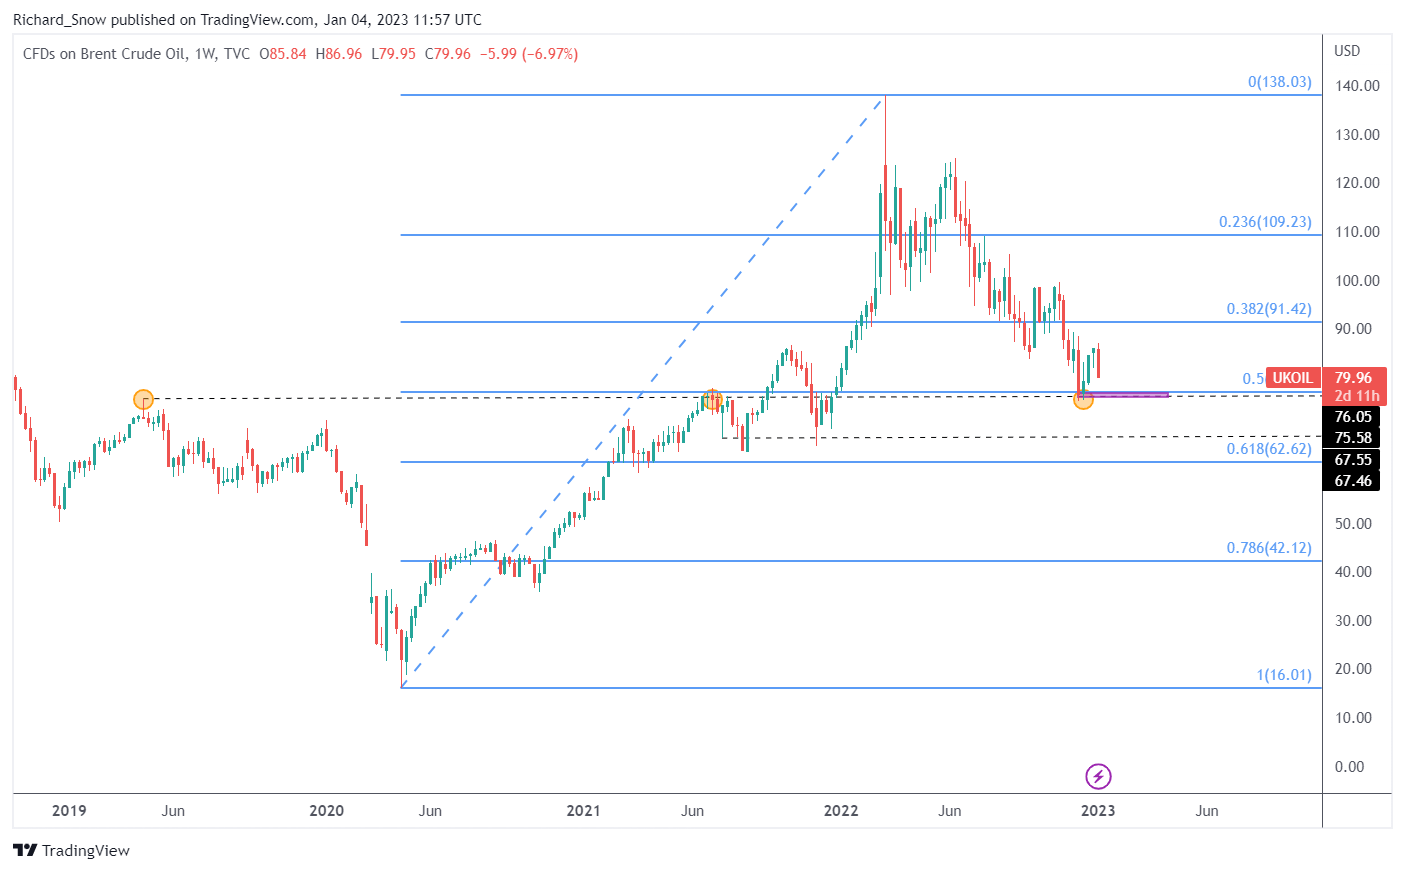
Source: TradingView, prepared by Richard Snow
The daily chart shows the proximity of current price action to the confluence zone of support and how prices turned sharply lower at the 50 SMA. Prices are on track for a sizeable two day decline upon a possible close below the rising wedge formation, which is typically bearish. Support at $76 followed by $67.55. Resistance naturally becomes the underside of the rising wedge formation, followed by the swing high at the 50 SMA ($87.37).
Brent Crude Oil Daily Chart
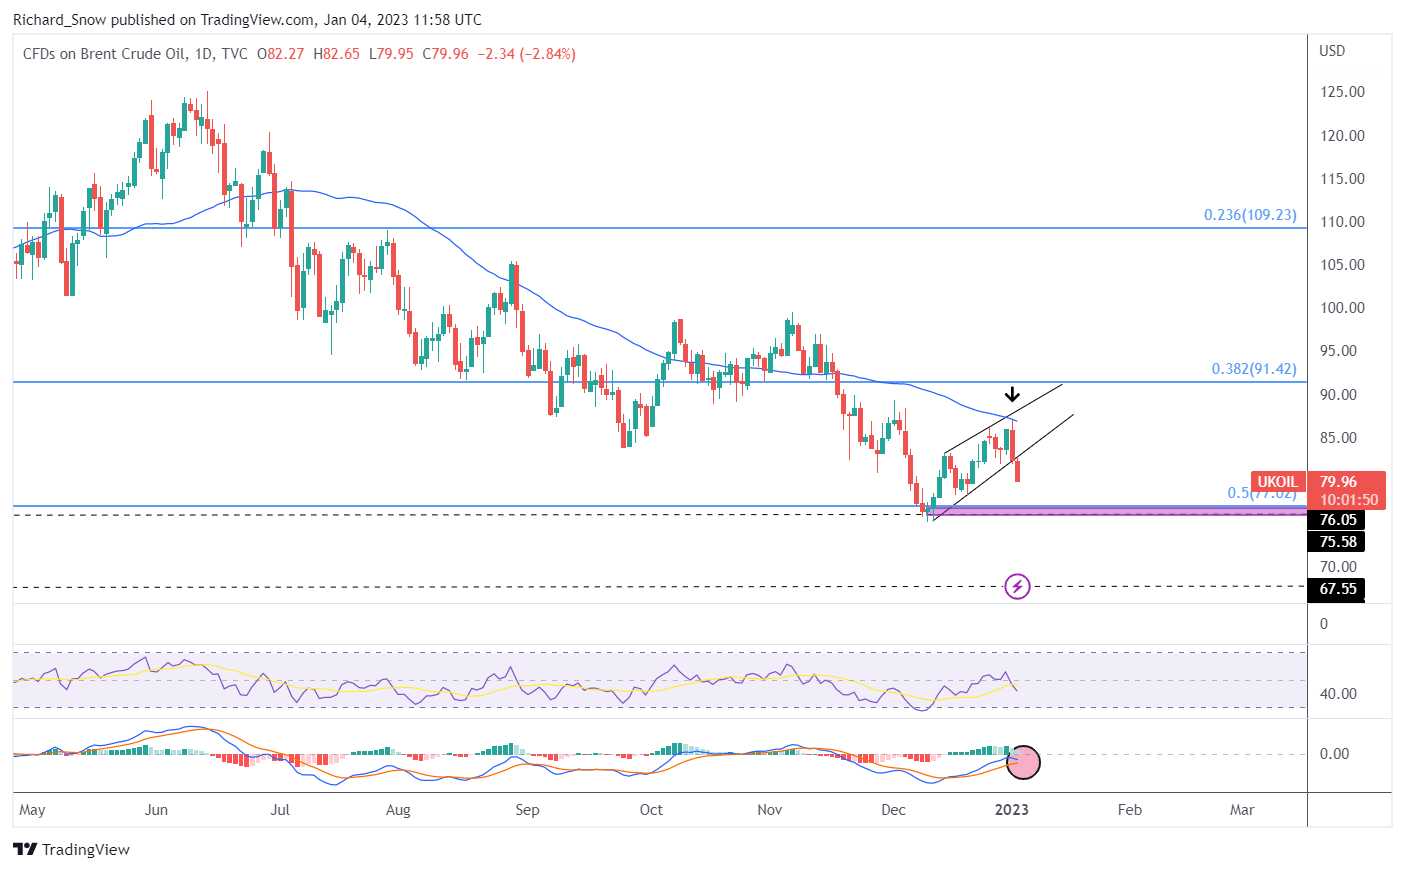
Source: TradingView, prepared by Richard Snow
US Crude IG Client Sentiment Hints at Bearish Continuation

Oil - US Crude: Retail trader data shows 69.11% of traders are net-long with the ratio of traders long to short at 2.24 to 1.
We typically take a contrarian view to crowd sentiment, and the fact traders are net-long suggests Oil - US Crude prices may continue to fall.
The number of traders net-long is 15.04% higher than yesterday and 6.30% higher from last week, while the number of traders net-short is 11.80% lower than yesterday and 13.19% lower from last week.
Traders are further net-long than yesterday and last week, and the combination of current sentiment and recent changes gives us a stronger Oil - US Crude-bearish contrarian trading bias.
--- Written by Richard Snow for DailyFX.com
Contact and follow Richard on Twitter: @RichardSnowFX


