
Bitcoin Technical Outlook: Price Action Remains Choppy Heading into Q4
This article is dedicated to examining the technical side of Bitcoin in Q4. If you're seeking a deeper understanding of the fundamental outlook and the pivotal drivers shaping Bitcoins prospects in the medium term, download DailyFX's all-inclusive fourth-quarter trading guide. The best part? It's free!

From a technical standpoint, 2023 has been excellent for Bitcoin however the last 2 months has seen the world’s largest Cryptocurrency put in losses which have seen jitters around a deeper retracement grow. September, however, has seen a bounce of the psychological $25000 mark and could potentially be the start of a new leg to the upside. A lot will depend on the current monthly candle close which appears to be on course for a Doji close (at the time of writing).
BTC/USD Monthly Chart
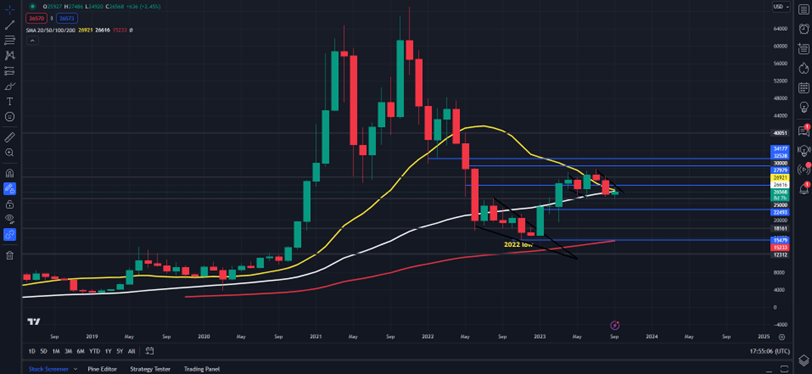
Source: TradingView, Chart Prepared by Zain Vawda
Dropping down to a weekly timeframe and price action has been choppy during the third quarter. Price has printed a higher high followed by a lower low providing mixed messaging with the previous week closing as a hammer but failing to follow through. There is a descending trendline in play which served as resistance this week around the $27800 mark which coincides with the 20 and 200-day MAs.
Looking for the best trade ideas for Q4? Look no further and download your complimentary guide courtesy of the DailyFX team of Analysts and Strategists.

A break above the descending channel would obviously need to clear the 200-day MA before a run toward the psychological $30000 level where we currently have the 100-day MA as well. If price is able to break above the $30000 mark it will provide a fresh challenge for Bitcoin bulls who have struggled to maintain any momentum above this price level.
A downside break from current levels has to contend with the $25000 level with the 50-day MA just resting below around the $24400 mark. Below that I have a key support area marked out at the $22500 with a break lower seeing a potential run toward the 2022 YTD low becoming a distinct possibility.
Key Levels to Keep an Eye On:
Support Levels:
• $25000 (Psychological Level)
• $22500
• $20000 (March 6 Swing Low)
• $15500 (2022 YTD Low)
Resistance Levels:
• $27800 (200-day MA)
• $30000 (Psychological level, 100-day MA)
• $32500
• $34177
BTC/USD Weekly Chart
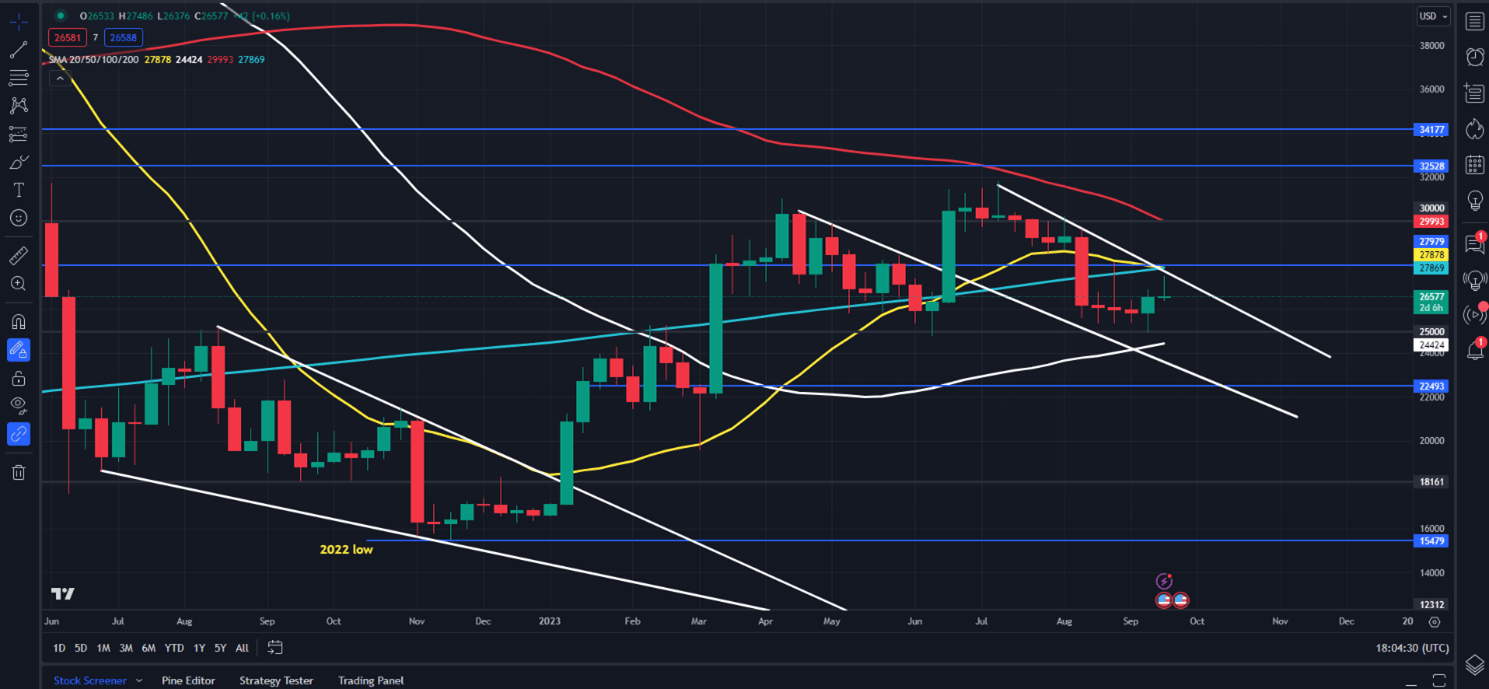
Source: TradingView, Chart Prepared by Zain Vawda
--- Written by Zain Vawda for DailyFX.com
Contact and follow Zain on Twitter: @zvawda