


Market Recap

Major US indices found room for some relief to start the week, after comments from China and Japan authorities supported their respective currencies and triggered a pullback in the US dollar (-0.5%) – its sharpest single-day drop in two months. Notably, the Nasdaq gained 1.1% despite a subdued showing in US Treasury yields, with the heavy-lifting revolving around a handful of big tech stocks. Individual corporate news seem to account for the uneven performance, with Tesla up 10% on Morgan Stanley’s rating upgrade, while both Meta and Amazon were up more than 3%.
Ahead, sentiment surveys around Australia and Germany, along with UK employment data will be on watch, although any market moves could be short-lived in the lead-up to the US Consumer Price Index (CPI) data release tomorrow. The upcoming US inflation data will be key to determine whether the Federal Reserve (Fed) may leave the door open for additional tightening in November or December, at a time where more Fed policymakers are putting greater emphasis on data-dependence lately and softening their tone around rate hikes.
Upcoming market moves may also depend on whether Apple can convince investors of its new products at its upcoming event, given the company’s heavy weightage in major US indices. Seasonality over the past 20 years has not been in favour however, with average performance generally ranging to slightly lower in the second half of September.
Having fallen below its Ichimoku cloud support on the daily chart, the US$180.00 level is now showing to be a key resistance to overcome, where its 100-day moving average (MA) coincides with a 23.6% Fibonacci retracement (from its January 2023 bottom to July 2023 peak). For now, the bears have rejected a crossover in its moving average convergence/divergence (MACD) above the key zero level on its daily chart. That said, some dip-buying was spotted at the US$173.54 level with the formation of a long-legged candle last week, which will now be a crucial support level to hold.
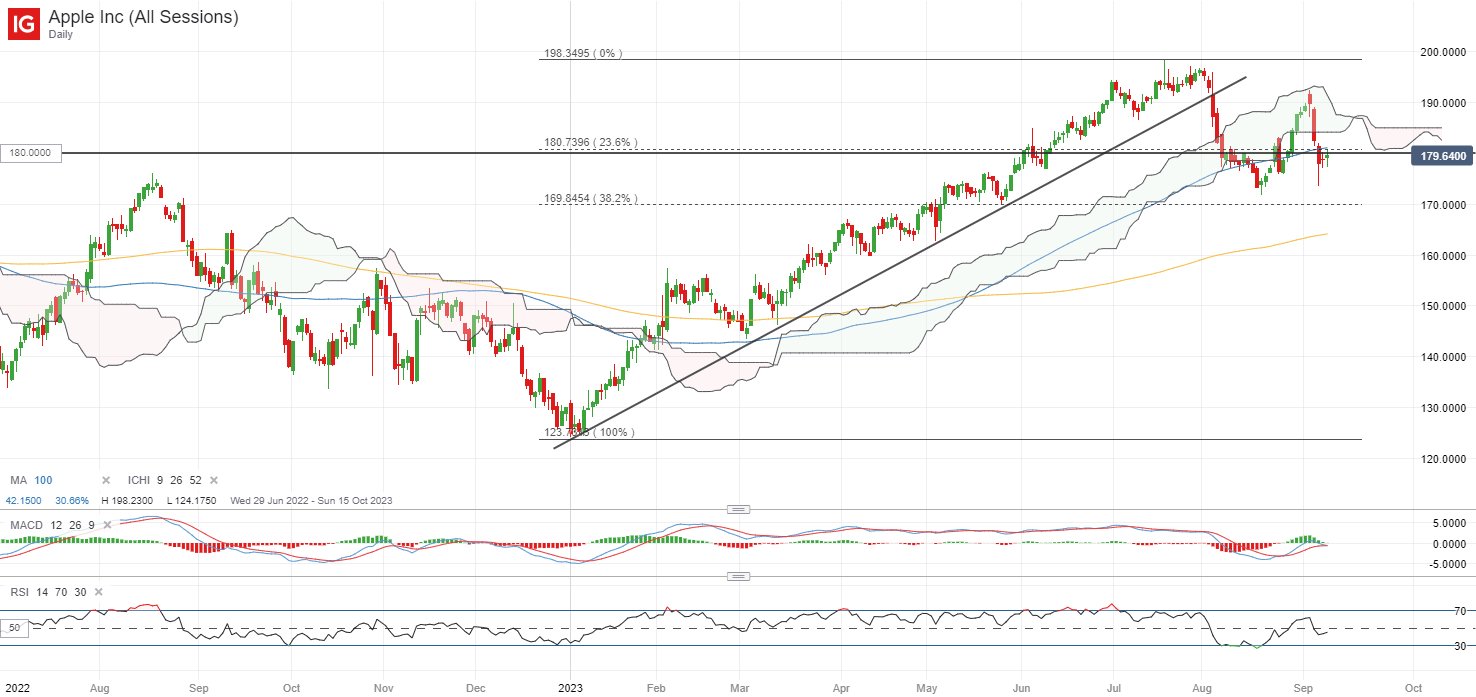
Source: IG charts
Asia Open
Asian stocks look set for a mixed open, with Nikkei +0.38%, ASX -0.41% and KOSPI -0.29% at the time of writing. Chinese equities attempted to regain its footing, with the Nasdaq Golden Dragon China Index up 1.2% overnight, although some paring of initial gains still points towards some reservations ahead of China’s data dump on Friday. Moderate improvement is expected from its retail sales and industrial production data, although the general trend over China’s economic data over the past three months has been one of downside surprises.
Renewed warnings from the People's Bank of China (PBoC) on yuan speculation has a -0.8% impact on the USD/CNH yesterday, following a bearish MACD divergence displayed on its daily chart. Further tightening of bulk dollar purchases by domestic firms will likely provide some follow-through to recent selling pressure, with the support confluence zone around the 7.230-7.260 level now placed on the radar as a key test for buyers ahead. The level marked a series of support lines, ranging from its Ichimoku cloud on the daily chart to an upward trendline support.

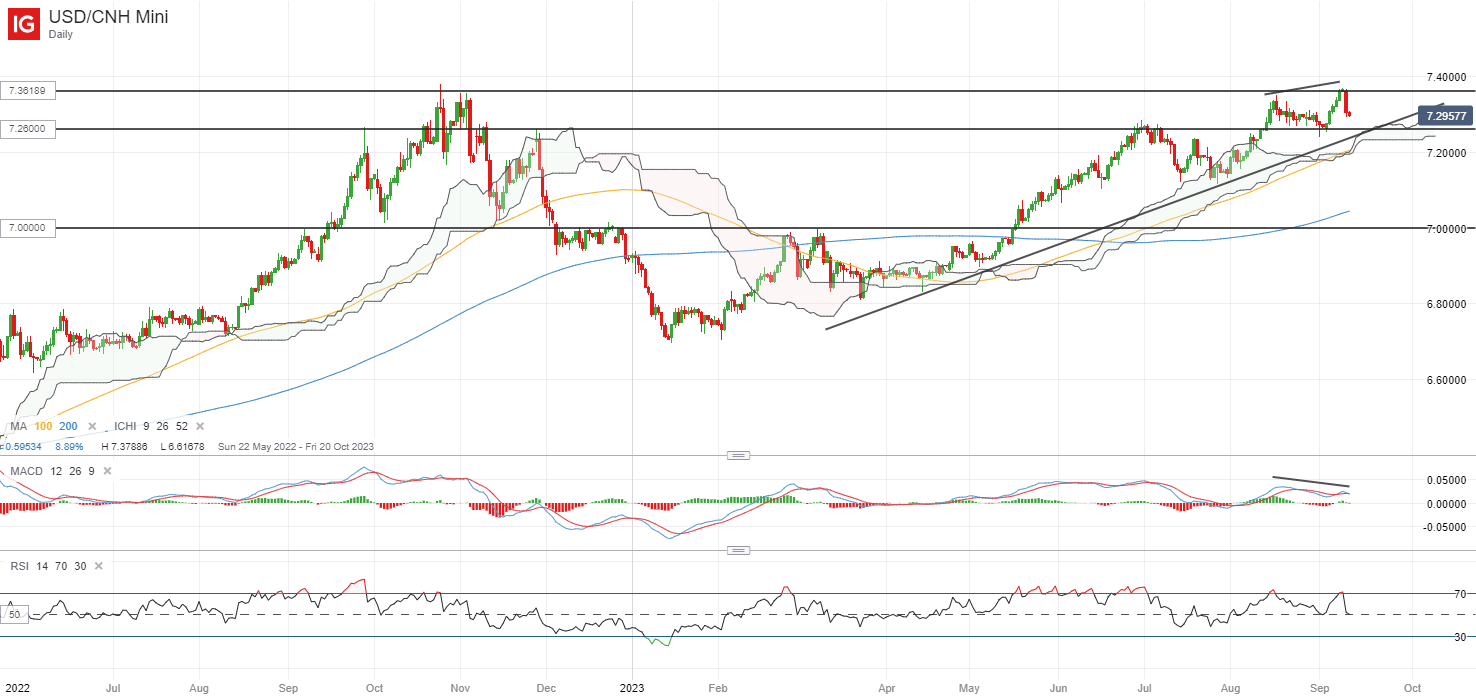
Source: IG charts
On the watchlist: EUR/USD attempts to stabilise ahead of US CPI and ECB rate decision this week
It is a major week for the EUR/USD, with the US CPI and ECB rate decision lined up on the horizon this week as key driving forces for the pair. Since mid-July this year, the pair has retraced as much as 5.2%, before attempting to stabilise lately on some US dollar weakness to start the week.
Technicals on the daily chart may reveal a potential bullish divergence on its RSI for now, with the RSI failing to form lower lows on recent bottoms, which may suggest abating selling pressures. That said, greater conviction for the bulls may have to come from a move back above the 1.080 level of resistance, where the lower trendline of a previous ascending channel since the start of the year stands. Failing to cross back into its previous channel pattern could still leave some doubts on recent upside, with its weekly RSI still trading below the key 50 level for the first time since November 2022.

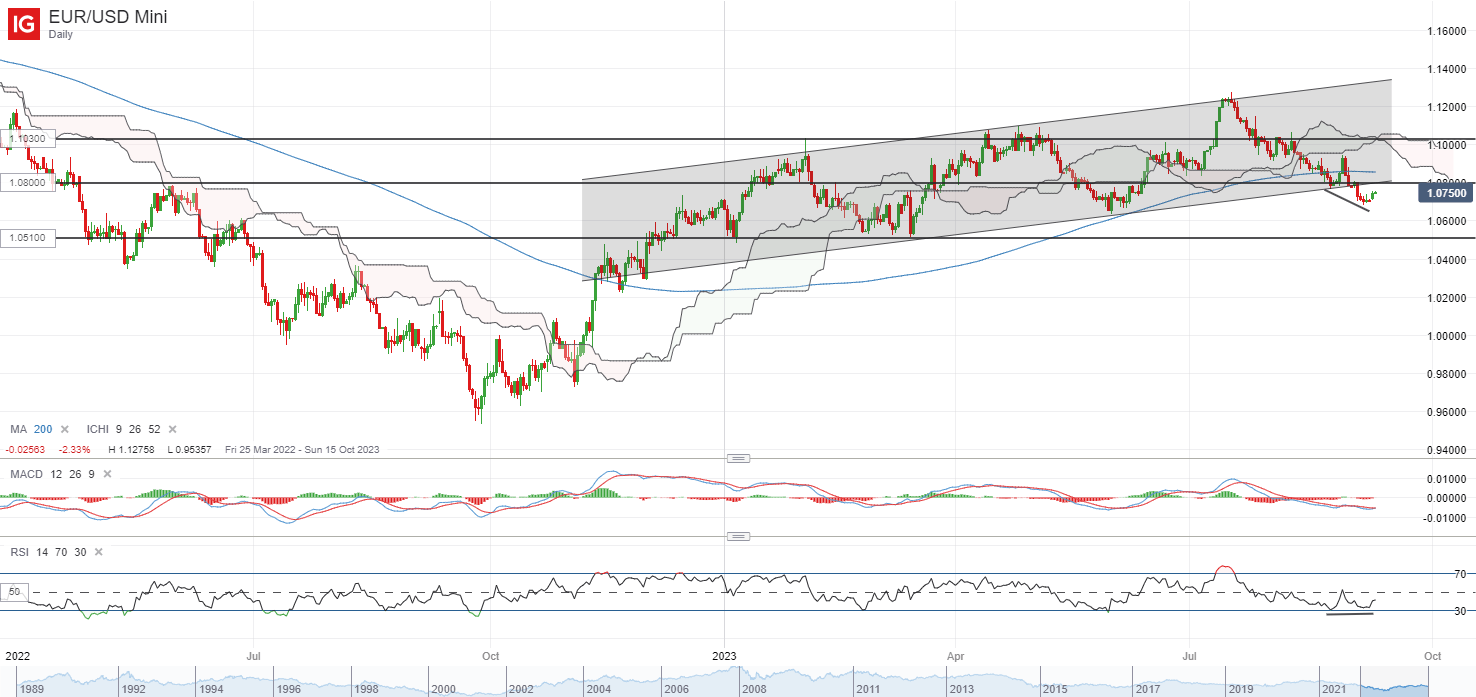
Source: IG charts
Monday: DJIA +0.25%; S&P 500 +0.67%; Nasdaq +1.14%, DAX +0.36%, FTSE +0.25%


