


Dow, S&P 500, Nasdaq 100, USD Price Analysis:
- After an aggressive sell-off in February and March, US equities have put in a strong bounce with the tech-heavy Nasdaq 100 gaining as much as 41% while both the Dow and S&P 500 have lagged.
- The US Dollar has moved into a range-mode over the past month, helping to bring back-and-forth price action on a number of major pairs.
US Equity Bifurcation Continues
As a recent theme in these webinars the divergence amongst major US equity indices has been a center-point. The tech-heavy Nasdaq 100 has continued to outperform the more broad based S&P 500; and both of those indices have outpaced the Dow Jones Industrial Average. That backdrop has remained with the Nasdaq 100 surging back into positive territory for the year after rallying by more than 41% from the March lows up to the May highs, as looked at in yesterday’s article on US equities.
Nasdaq 100 Four-Hour Price Chart
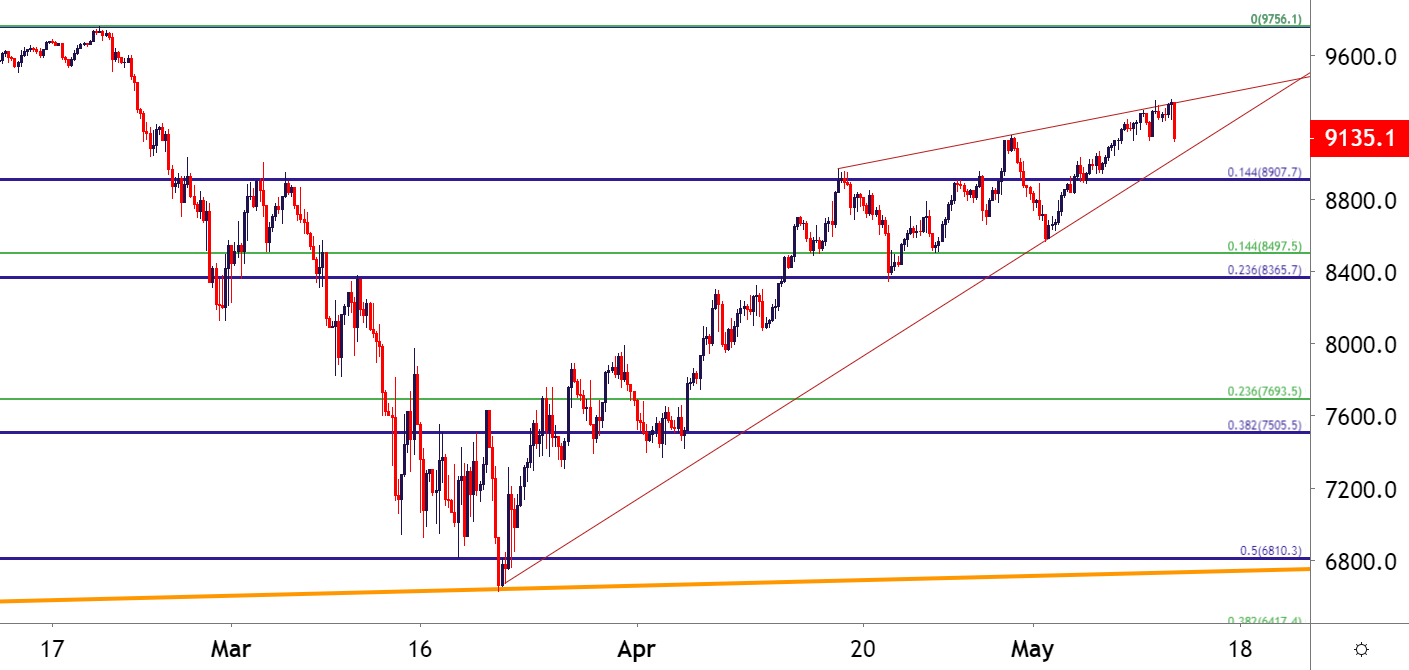
Chart prepared by James Stanley; Nasdaq 100 on Tradingview
S&P 500 Fights with Fibonacci Resistance
Resistance in the S&P 500 has remained around the 61.8% retracement of the February-March sell-off.
S&P 500 Four-Hour Price Chart

Chart prepared by James Stanley; SPX500 on Tradingview
Dow Jones Remains a Laggard as Resistance Holds at Key Area
Of the three major US equity indices, the Dow may be looked at as the weakest given the fact that the initial sell-off was more harsh and the corresponding bounce-back has been shallower. In the webinar, I showed a trendline for a comparable analysis between the Nasdaq 100 and the Dow, taken from the swing lows in 2016 and 2018. In the Nasdaq, this trendline projection helped to cauterize the March low. In the Dow, the trendline was violated and is currently acting as resistance.
Dow Jones Weekly Price Chart

Chart prepared by James Stanley; Dow Jones on Tradingview
USD Remains in Range
Little to get excited about near-term on the US Dollar: The currency has remained range-bound since that influx of volatility in the month of March. In the webinar, I looked at range potential around the currency, and this is a theme that can be extrapolated to many major pairings.
US Dollar Four-Hour Price Chart

Chart prepared by James Stanley; USD on Tradingview
--- Written by James Stanley, Strategist for DailyFX.com
Contact and follow James on Twitter: @JStanleyFX


