


Nasdaq 100, S&P 500, Dow Jones Price Analysis
- US equities continue to hold on to gains despite grim economic data such as last week’s Non-Farm Payrolls report.
- The massive move in February-March has been largely offset in the Nasdaq 100 as the index is back in positive territory for 2020 trade.
- The S&P 500 and Dow Jones have seen less-enthusiastic bullish runs, creating an interesting case of divergence in recent performance amongst major American US equity indices.
Nasdaq 100 Re-Ascends into Positive Territory for 2020 Trade
US stocks have continued to hold on to gains even as economic data prints with a very disappointing tone. Last Friday produced one of the nastiest NFP reports that any of us have ever seen as the unemployment rate skyrocketed up to 14.7% after having held near 50-year lows before the novel coronavirus came into the equation. The headline print was perhaps even more attention-grabbing as a whopping 20.5 million jobs, net, have left the US workforce.
Of course, hope remains that a V-shaped recovery may soon be in the cards as reopening has begun in a large swath of the US; and given the massive amounts of stimulus that have already been announced, the expectation appears to be that future economic hardships will be met with even more government action, in one way or the other. Case in point, the Nasdaq 100 has now re-entered positive territory for the year of 2020 after rallying above the yearly open around the 8884 level.
That may sound surprising considering that the Nasdaq 100 was, at one point, down by more than 32% from the February highs to the March lows. At this stage, the index is up by a little over 5% for the year, as of this writing; and appears to be in stronger health than both the S&P 500 and the Dow Jones Industrial Average which both remain in negative territory for 2020 trade.
Nasdaq 100 Four-Hour Price Chart
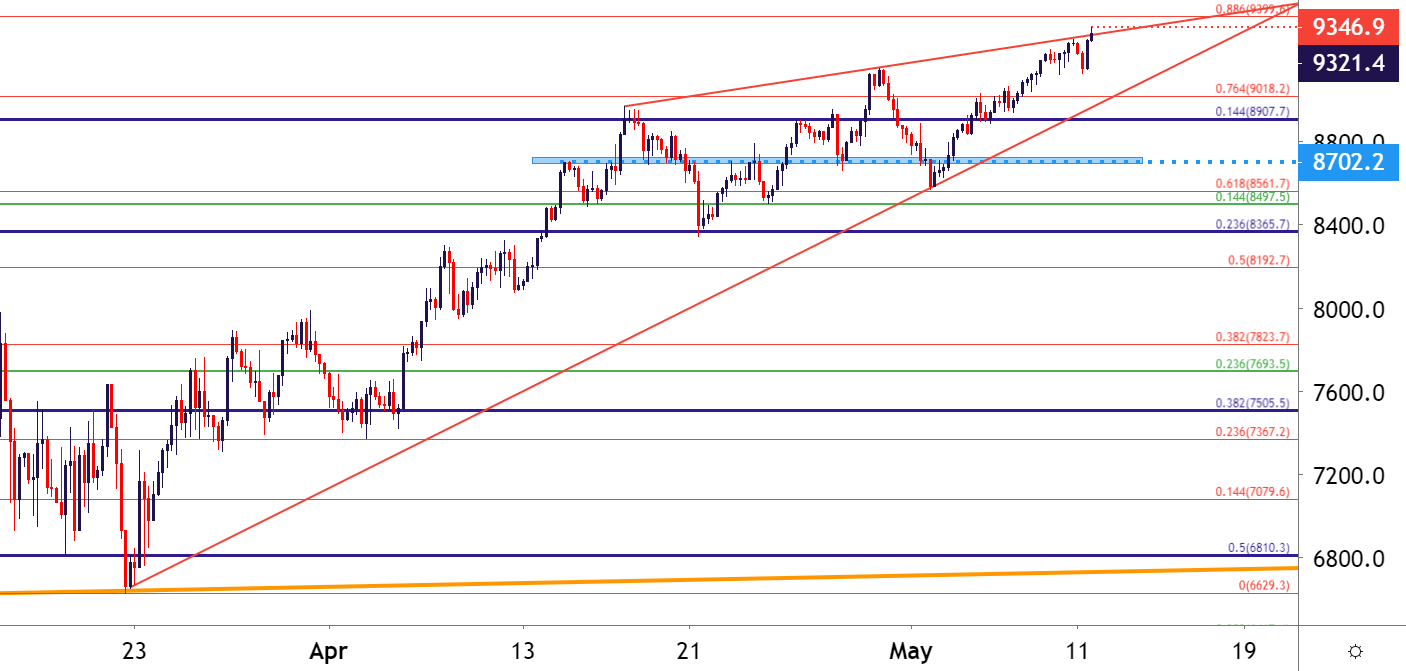
Chart prepared by James Stanley; Nasdaq 100 on Tradingview
As looked at previously, the Nasdaq 100 remained potentially attractive to US equity bulls, largely taken from the fact that the 32% sell-off in the index was a bit more shallow than what was seen in both the Dow and the S&P 500. And the corresponding bounce has similarly been stronger in the Nasdaq, with investors around-the-world pouncing on tech stocks in popular names like Apple, Netflix, Google and Facebook.
At this point, the fear around the Nasdaq 100 may be just how far its run already, with the index up a whopping 41% from the lows set just two months ago. From the weekly chart below, price action is fast approaching that prior all-time-high that was set in February, which is now less than 5% away from current prices (again, as of this writing). Taking a step back to the weekly chart, notice the bullish trendline (in Gold/Yellow) that helped to cauterize the March low. We’ll bring this back when looking at the Dow Jones Industrial Average below.
Nasdaq 100 Weekly Price Chart
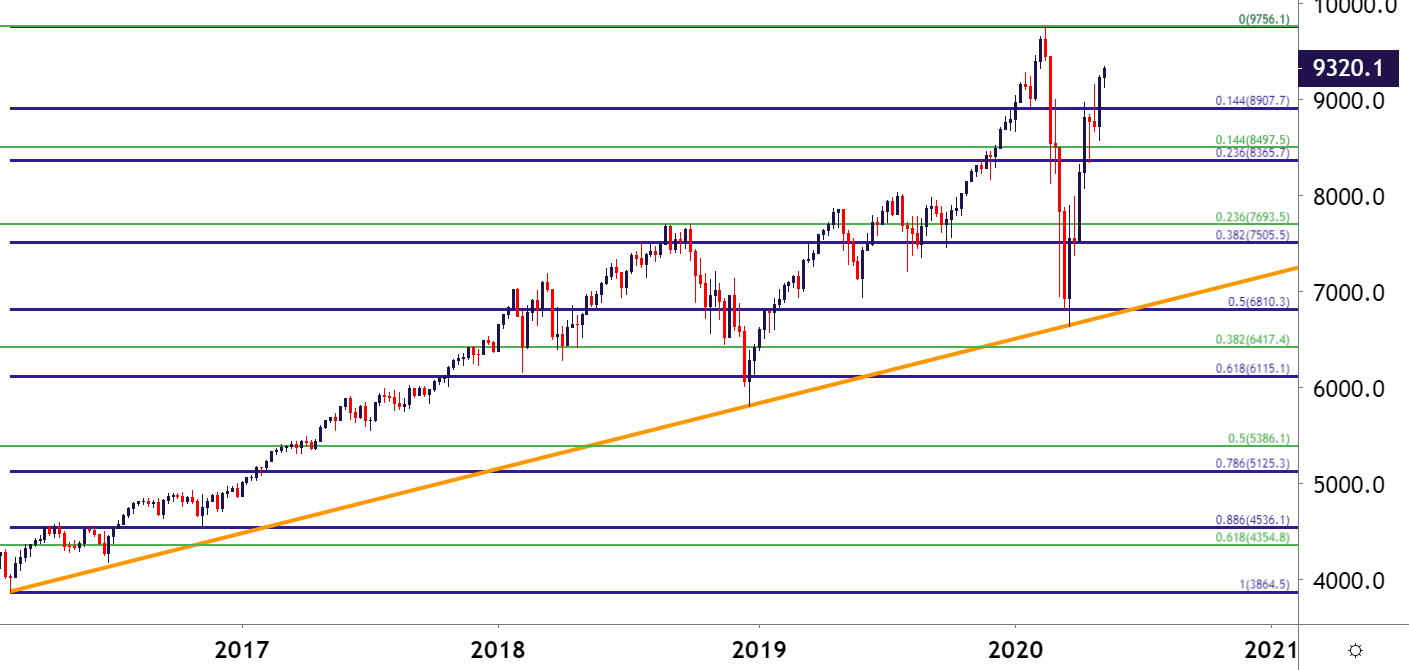
Chart prepared by James Stanley; Nasdaq 100 on Tradingview
Comparatively, it’s been a similar albeit abbreviated move in the S&P 500, which is now up by more than 34% from those March lows. Unlike the Nasdaq 100, however, which is currently rallying up to fresh two-month-highs, the S&P 500 has remained subdued below the April 30th high of 2972. This may be due to a looming batch of resistance sitting overhead, very near the psychological 3,000 level in the index; but as looked at previously, the February-March sell-off cut a little deeper and the corresponding bounce wasn’t as strong as what was seen above in the Nasdaq 100.
S&P 500 Four-Hour Price Chart
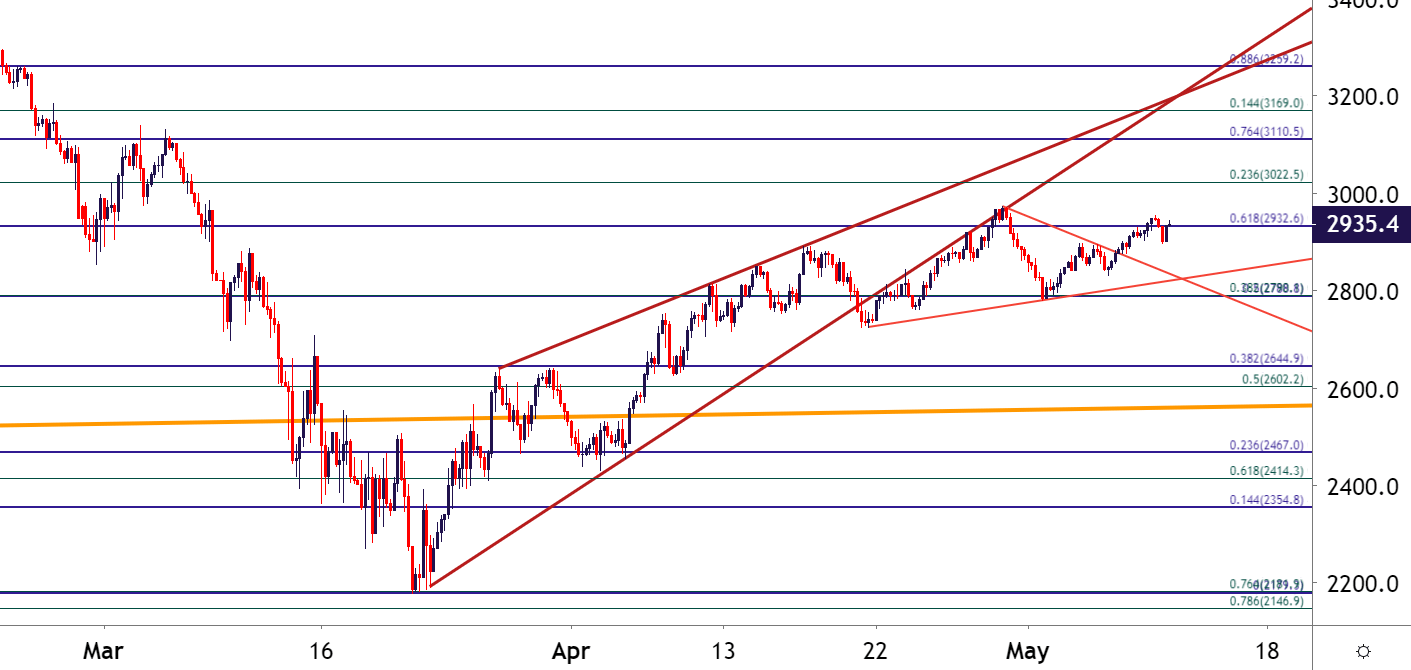
Chart prepared by James Stanley; SPX500 on Tradingview
For bearish US equity outlooks, the Dow Jones Industrial Average may remain as one of the more prominent US indices for investors pick on. Again, the sell-off was a bit deeper and the corresponding bounce more-shallow; the Dow is currently battling through a confluent zone of resistance around the 24,100 level on the chart, and hasn’t been able to break much fresh ground beyond that point.
Taking a step back to the weekly, and a similarly placed trendline to what was looked above in the Nasdaq 100 tells a very different story. This trendline connects swing lows from 2016 and 2018; and in the Nasdaq 100, this trendline helped to mark the March lows. But in the Dow – not only did that trendline get traded through; but it continues to help define resistance today, helped along by a couple of Fibonacci levels and prior swing-highs.
Dow Jones Weekly Price Chart
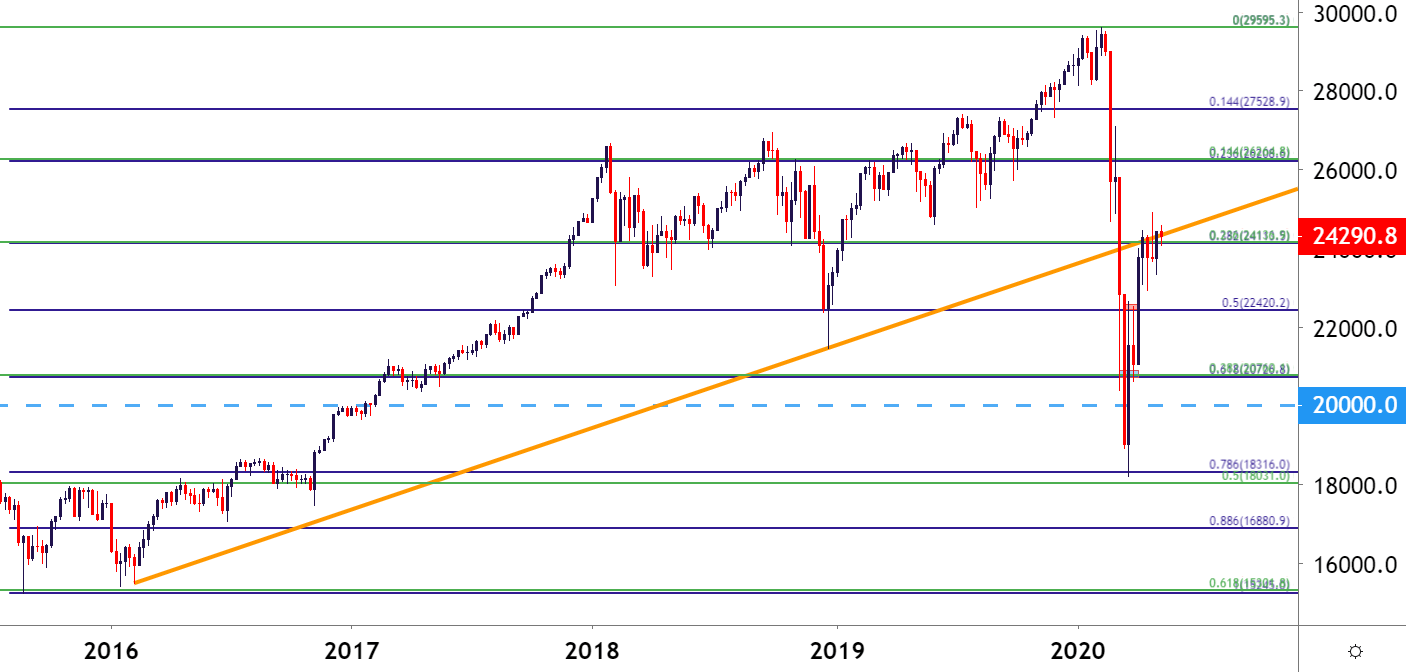
Chart prepared by James Stanley; Dow Jones on Tradingview
Taking a closer look, and the Dow Jones has been mean-reverting for almost a full month now. Bulls have yet to re-engage with the psychological 25k level, although they got close in late-April.

This could keep the Dow as the sore spot amongst the three noted indices; as that laggard performance combined with overhead resistance, combined with the above comparisons paint a much less rosy picture in the DJIA versus the Nasdaq 100, or even the S&P 500.
Dow Jones Four-Hour Price Chart
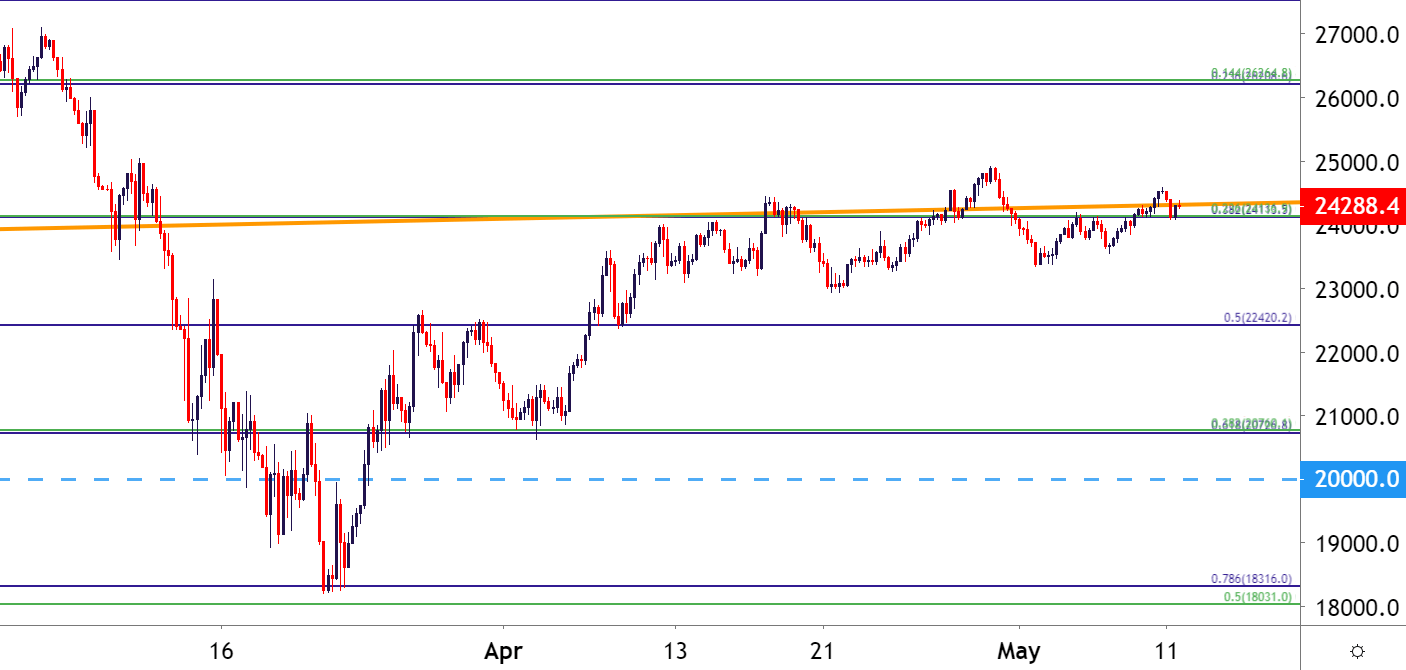
Chart prepared by James Stanley; Dow Jones on Tradingview
--- Written by James Stanley, Strategist for DailyFX.com
Contact and follow James on Twitter: @JStanleyFX


